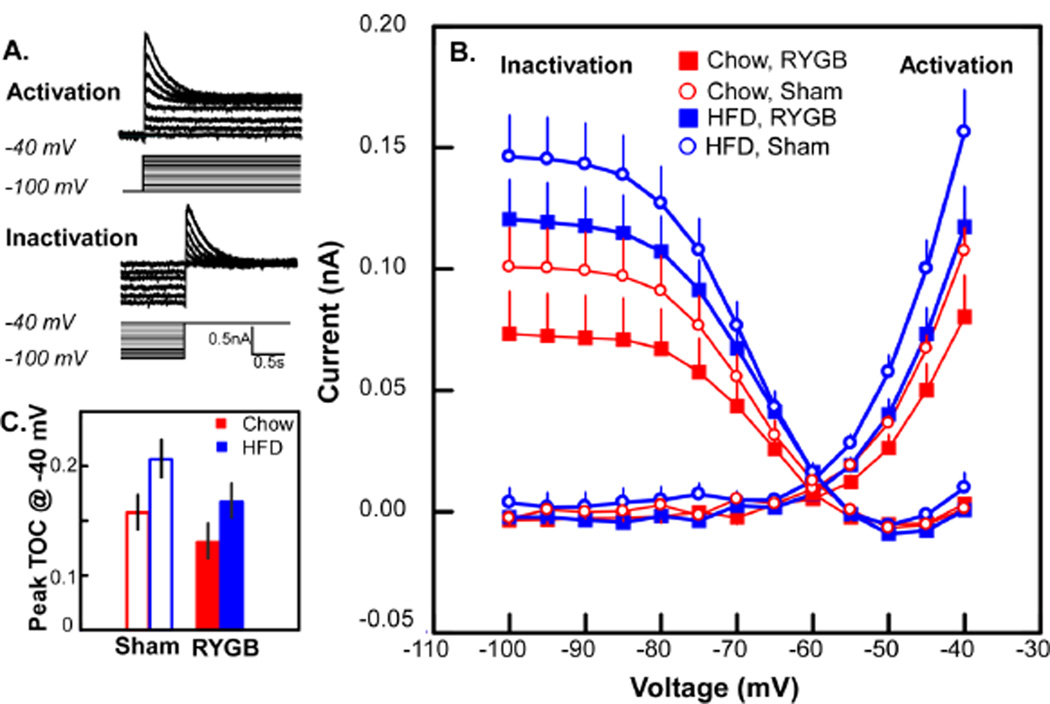
Fig. 5.
A. Example of the protocol for activation and inactivation for a transient outward current (TOC). For clarity, only a subset of recorded traces are shown; voltage steps for which recorded traces are not shown are designated in grey. B. Mean inactivation and activation curves for a TOC across the 4 experimental groups. ANOVA demonstrated significant main effects for both diet (P < .03) and surgery (P < .02) for the activation curve whereas only diet was significantly different for the inactivation curve (P < .02, see text). C. Bar graph for TOC observed at −40 mV exemplifies main effects: a high fat diet (HFD) is associated with a larger TOC and RYGB surgery suppresses the increased TOC. Note that RYGB in the HFD group reduced TOC to levels similar to sham operated chow animals.

