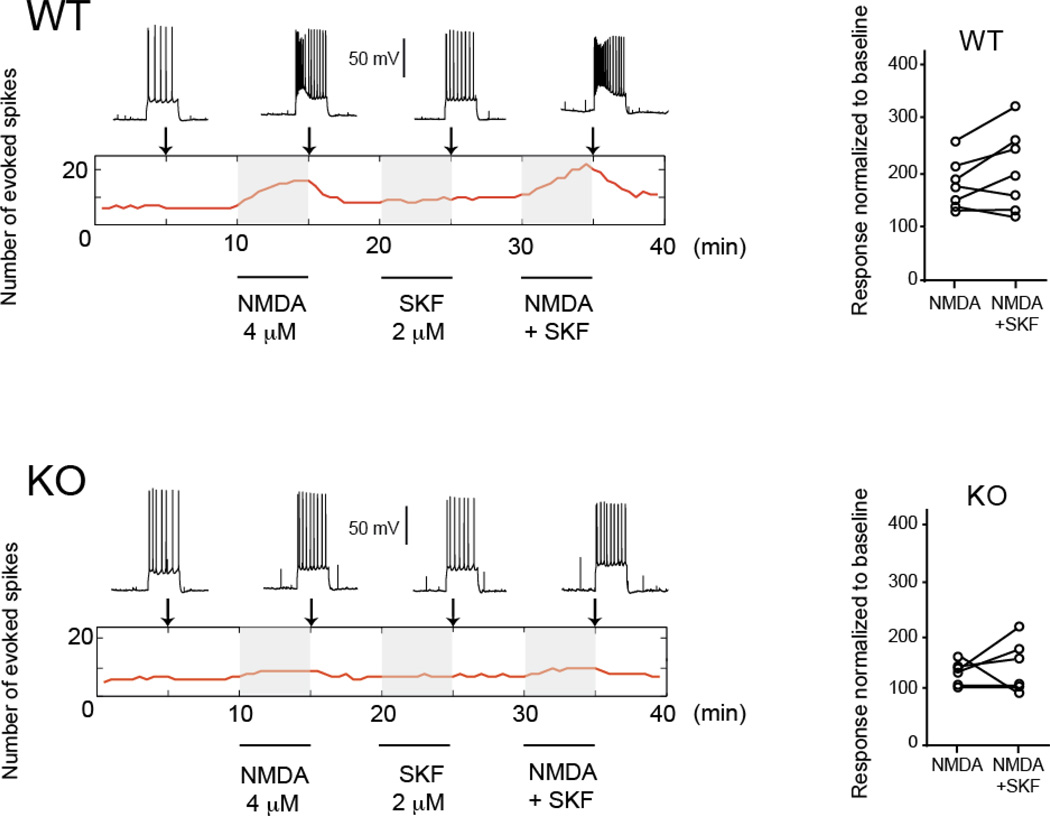
Figure 2. NMDA effects on prefrontal cortex pyramidal cell excitability in adult Pick1 knockout mice.
Top: Examples of traces used to assess excitability 5 min before 4 µM NMDA application (left), after 5 min of NMDA perfusion, after 5 min of the D1 agonist SKF38393 (SKF, 2 µM), and during the combined perfusion of 4 µM NMDA and 2 µM SKF in a prefrontal cortical slice from a wild-type mouse. The rectangular area with the red line indicates the changes in the number of evoked action potentials over time with the three treatments (NMDA alone, SKF alone, NMDA+SKF, shaded areas). The vertical arrows indicate the time at which the traces on top were obtained. Right, population data indicating normalized responses to baseline after NMDA alone and NMDA + SKF. Bottom: Similar display for a representative prefrontal cortex prefrontal cortex pyramidal neuron in a Pick1 knockout mouse (left) and population data for NMDA and NMDA + SKF for all knockout mice recorded, showing a reduced NMDA effect in slices from Pick1 knockout mice.

