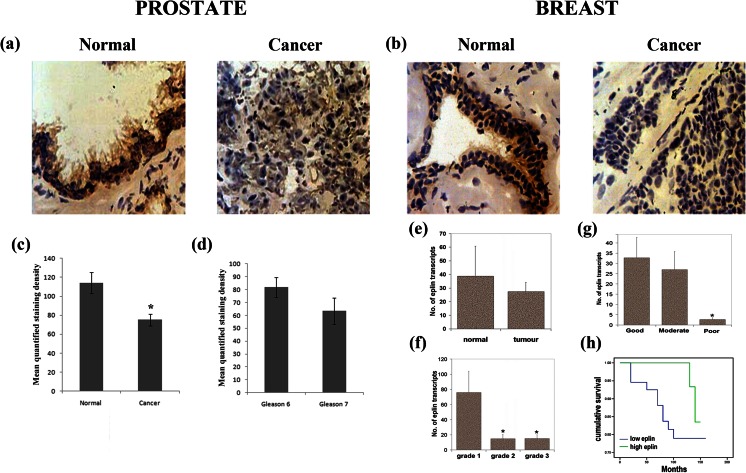
Fig. 7.
EPLIN profile in clinical prostate and breast cancer. Immunohistochemical staining (×20 objective magnification) of normal and cancerous a prostate and b breast clinical samples demonstrating EPLIN localisation and expressional differences. c, d Semi-quantitative analysis of EPLIN staining within prostate clinical cohort demonstrates that lower levels of EPLIN staining are associated with cancerous and higher-grade samples. e Within a clinical breast cancer cohort, lower transcript expression of EPLIN is seen in tumour samples compared to normal breast tissue and was associated with a higher grade (f), a poorer patient prognosis (g) and reduced overall survival rates (h). Figure modified from [10, 12]

