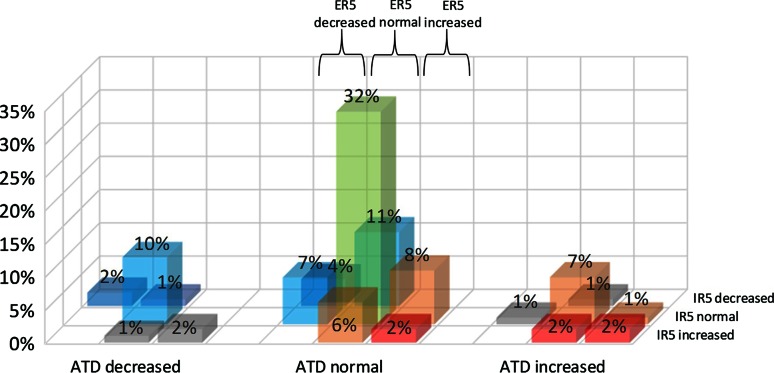
Fig. 6.
Distribution of laxity profiles expressed in percentage (%). Decreased: laxity score <−1, normal: laxity score between −1 and 1, increased: laxity score >1. ATD200: anterior tibial displacement at 200 N, IR5: internal rotation at 5 Nm, ER5: external rotation at 5 Nm. Knee laxity profiles: green—normal for all three directions, light blue—decreased for one direction, dark blue—decreased for at least two directions, orange—increased for one direction, red—increased for at least two directions, grey—mixed profile, increased and decreased scores

