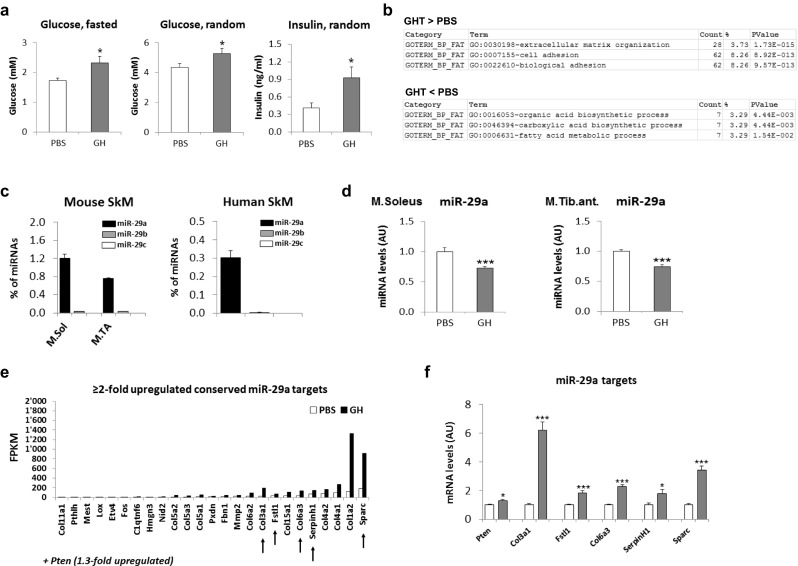
Fig. 1.

GHRT regulates miR-29a expression in skeletal muscle from GHD mice. GHD mice were treated with PBS or GH for 3 weeks and serum samples and tibialis anterior and soleus muscle harvested. a Blood glucose and serum insulin levels in GHD mice with (GH) or without (PBS) 3 weeks of GHRT. b Total RNA isolated from tibialis anterior muscle from GHD mice treated with PBS or GH was analyzed using RNA deep sequencing. The three most significantly regulated functional clusters are depicted for the group of genes that are increased after GHRT (GHT > PBS) or decreased (GHT < PBS). c RNA from mouse soleus muscle (M.Sol), tibialis anterior muscle (M.TA), or lower leg muscles from two healthy human subjects (M. rectus femoris and M. fibularis brevis, respectively) was analyzed using small RNA deep sequencing and results expressed as percent of all detected miRNA sequences. n = 2 for each muscle group. d qRT-PCR analysis of miR-29a in RNA from tibialis anterior muscle normalized to miR-let-7 and shown as arbitrary units (AU). Analysis was performed in the same mice as described in a. e All predicted miR-29a targets that are conserved between mice and humans and upregulated by GH in the RNA sequencing data described in b ≥2-fold shown as FPKM (fragments per kilobase of exons per million fragments mapped). Selected targets as described in the text are pointed out by arrows. f qRT-PCR analysis of gene expression in skeletal muscle after GH (gray) or PBS treatment (white). mRNA was normalized to 18S RNA and shown as AU. Results (a, d, f) show combined data for male and female mice (n = 7 for GH and n = 8 for PBS) and were analyzed using Student’s t test. *p < 0.05, ***p < 0.001
