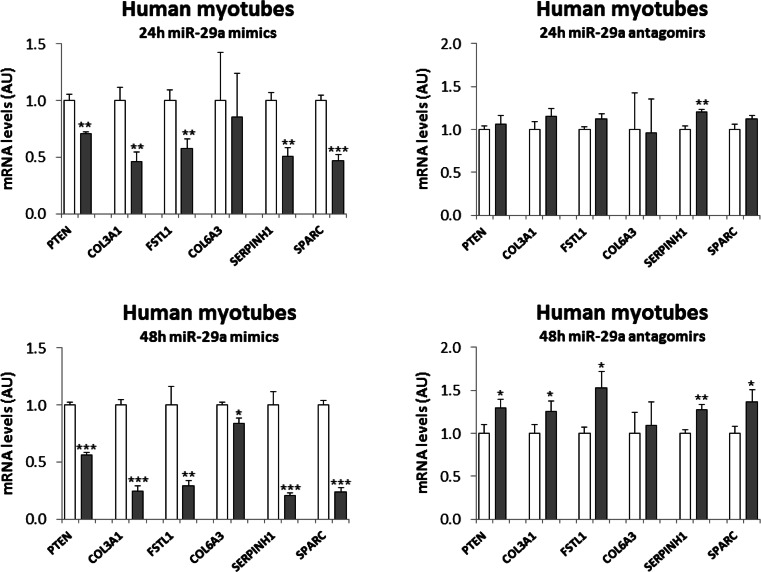
Fig. 2.
Target gene regulation in human myotubes by miR-29a. Human myotubes were transfected with miR-29a mimics or antagomirs or the respective scrambled controls. After the indicated time intervals, cells were harvested for RNA isolation. Results are shown for qRT-PCR analysis after miR-29a mimic transfection (gray) compared to control (white), n = 4, or after antagomir-29a transfection (gray) compared to control (white), n = 4–5. Results were normalized to 18S RNA and shown as arbitrary units (AU). Student’s t test was used to compare the two groups. *p < 0.05, **p < 0.01, ***p < 0.001

