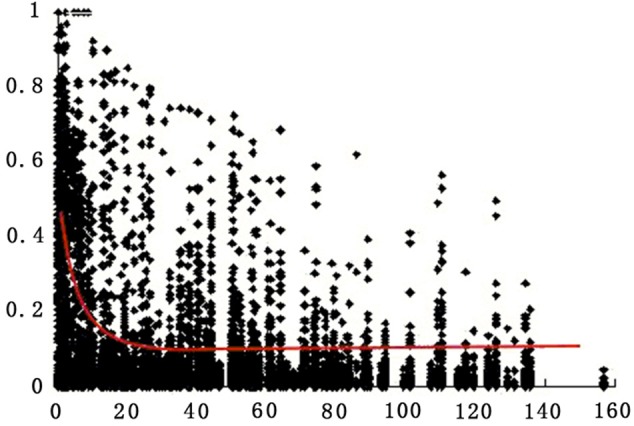
Figure 3.

Estimates of LD (r2) over genetic distance on all chromosomes for all 174 tomato accessions. Only polymorphic sites with MAF >0.05 are indicated (see Materials and Methods). Plot of r2 over genetic distance if fitted by non-linear regression (red curve).
