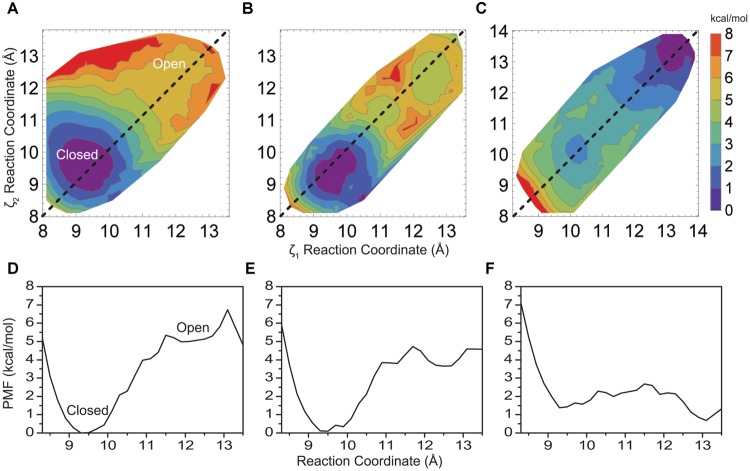
FIGURE 2.
(A) Two-dimensional PMF profile for native KcsA M2 bundle, (B) mutant E118A/E120, and (C) mutant E118A/E120A/T112+ KcsA M2 bundle shown in a contour plot as a function of reaction coordinates ζ1 and ζ2. Each colored contour represents approximately 1 kcal/mol. (D) One-dimensional profile (ζ1 = ζ2) of the PMF for the native KcsA M2 bundle, (E) mutant E118A/E120A, and (F) mutant E118A/E120A/T112+ KcsA M2 bundle shown in (A–C) as dotted lines.

