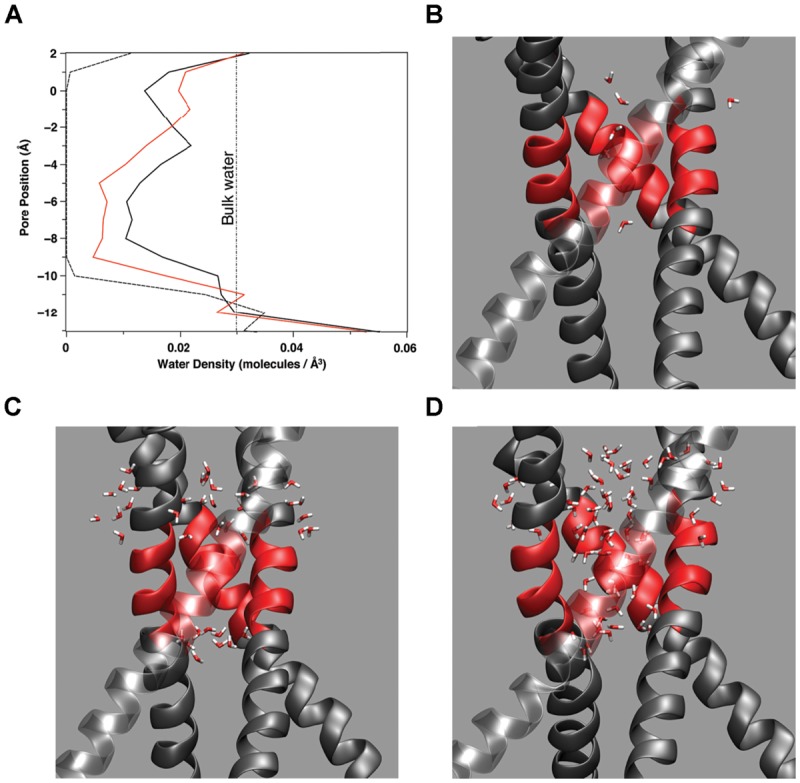
FIGURE 5.

(A) Water density as a function of location along the (z) pore axis for three amino acid mutations: A108S/A111S (dashed line), E118A/E120A/T112+ (red line), A108S/A111S/V115S (black line). The curves are constructed from the average number of water molecules within a 1 Å thick slice of the pore over 2 ns simulation time during stable, fully equilibrated simulations. The vertical dashed line indicates the average bulk density of water. Partial snapshots from simulations with the hydrophobic patch of M2 highlighted in red are shown for a (B) dewetted patch, (C) partially wetted pore region, and (D) fully hydrated pore region.
