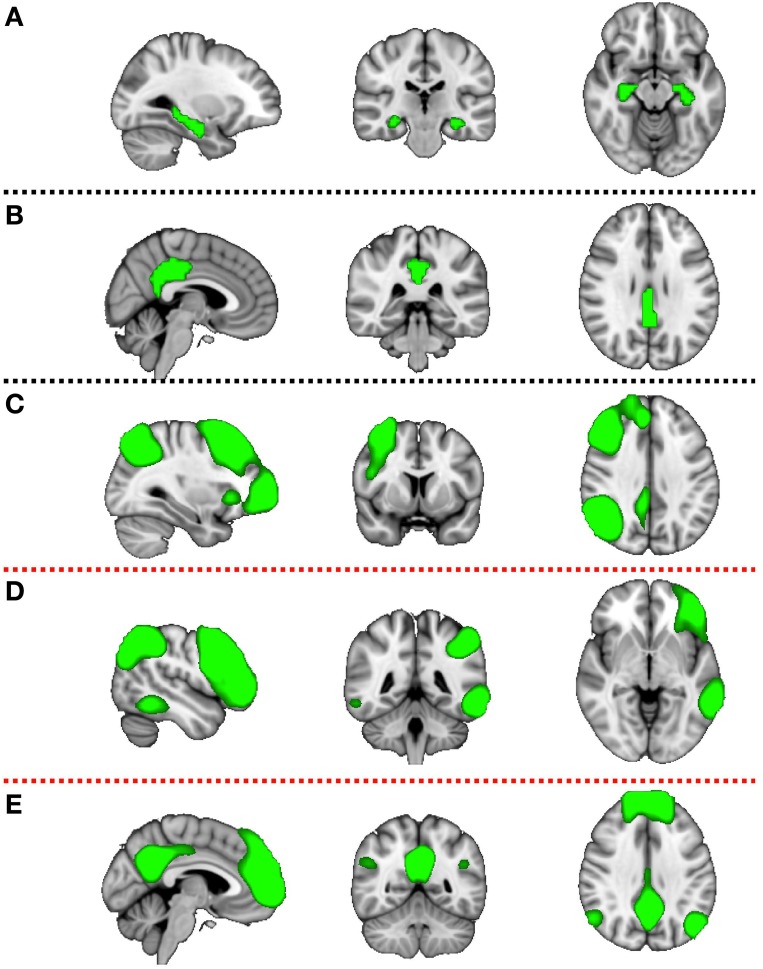
Figure 2.
Five masks used in further dual-regression analysis. The figure shows the three most informative orthogonal slices for each mask. Green colored mask is scaled to fit and superimposed onto the 1-mm standard MNI152 standard space template image. Masks are: (A) left and right hippocampus (Montreal Neurological institute (MNI) coordinates x = 3, y = −35, z = 28), (B) posterior cingulate cortex (x = −28, y = −24, z = −14), (C) right fronto parietal network (x = 32, y = 7, z = 35), (D) left fronto parietal network (x = −47, y = −44, z = −4), (E) default mode network (x = −4, y = −53, z = −35). First two masks (A,B) are binary masks, while last three (C–E) are components produced by the group ICA decomposition of rsfMRI data and converted to Z statistic images via normalized mixture-model fit, and thresholded at arbitrary threshold Z = 3 for visualization purposes.

