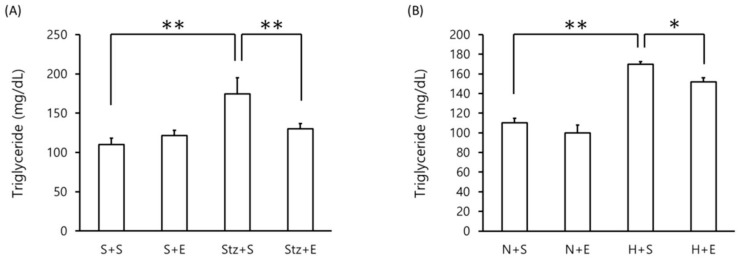
Figure 1.
Blood triglyceride levels in DM mice. Blood triglyceride levels were measured in (A) streptozotocin-induced type 1 DM mice at day 20 and (B) high-fat diet-induced type 2 DM mice at day 140. Data is shown as the mean±SEM of 7 mice. One-way ANOVA followed by Fisher's PLSD test was used for statistical analysis. S, saline; E, EGb 761; Stz, streptozotocin; N, normal diet; H, high-fat diet. Statistical significance are shown for Stz+S vs S+S, Stz+E vs Stz+S, H+S vs N+S, H+E vs H+S. *p <0.05, ** p <0.01.

