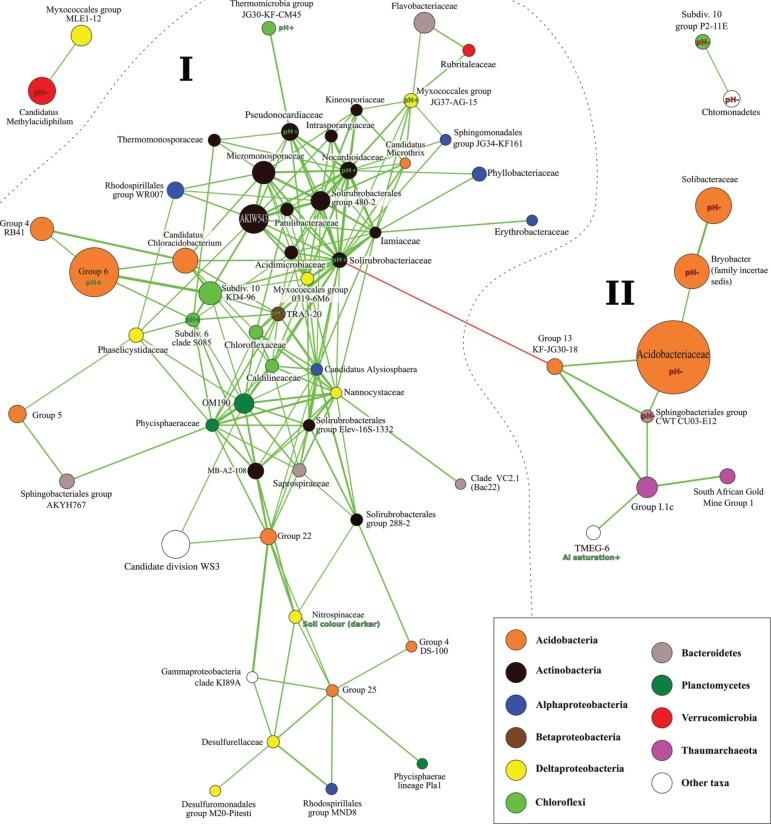
Figure 6.
Kendall rank-correlation network of taxa based on relative abundances across samples. Taxa are represented by circles and colored according to taxonomic identify (see legend). Circle size is proportional to average abundance across datasets (cut-off for inclusion = 0.01%) and thickness of edges to strength of correlation (cut-off for inclusion: |τ| > 0.8). Significant correlation to environmental parameters is annotated.

