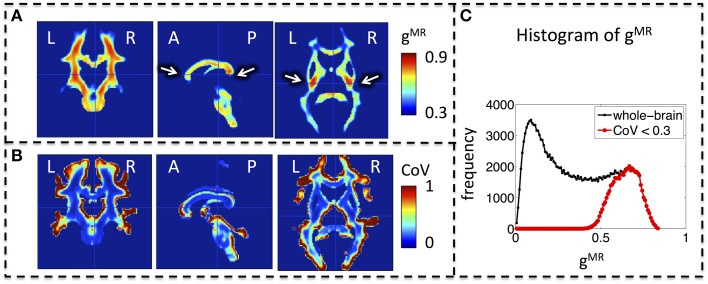
Figure 3.
Group MR g-ratio (gMR) maps. (A) Map of mean MR g-ratio. The highest values occurred in the genu, midbody, and splenium of the corpus callosum and within the cortico-spinal tracts (arrows). (B) Map of coefficient of variation (CoV) of MR g-ratio. Inter-individual variation was particularly high at the edges of white matter pathways. (C) Histogram of mean MR g-ratio in white matter showed a broad distribution (0–0.8) when the whole brain was considered but became narrower (0.5–0.8) when the analysis was restricted to voxels with COV < 0.3. Abbreviations: L, left; R, right; A, anterior; P, posterior.

