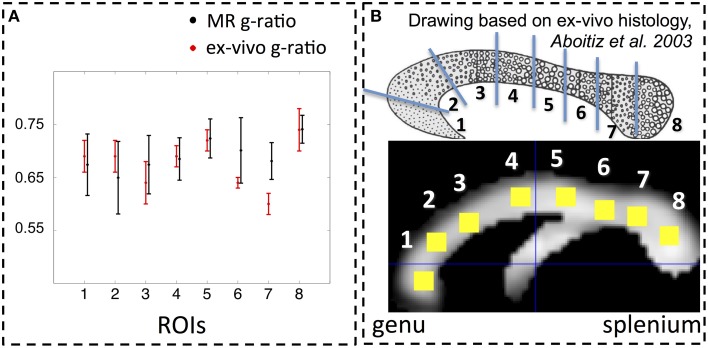
Figure 4.
(A) Comparison between MR (black) and ex-vivo (red) g-ratio measures in the corpus callosum. (B) Following the parcellation of the corpus callosum by Stikov et al. (2014a) for ex-vivo histology (top row), we calculated the group mean MR g-ratio in 8 different region of interests (ROI, bottom row; error bars indicate standard deviation across ROI) and compared them to the corresponding ex-vivo g-ratio reported by Stikov et al. (2014b) (error bars indicate standard deviation across 3 different samples within each ROI). The MR g-ratio measures followed the trend of the ex-vivo measurements (A). Note that the ex-vivo measurements of the g-ratio were obtained from a macaque monkey.

