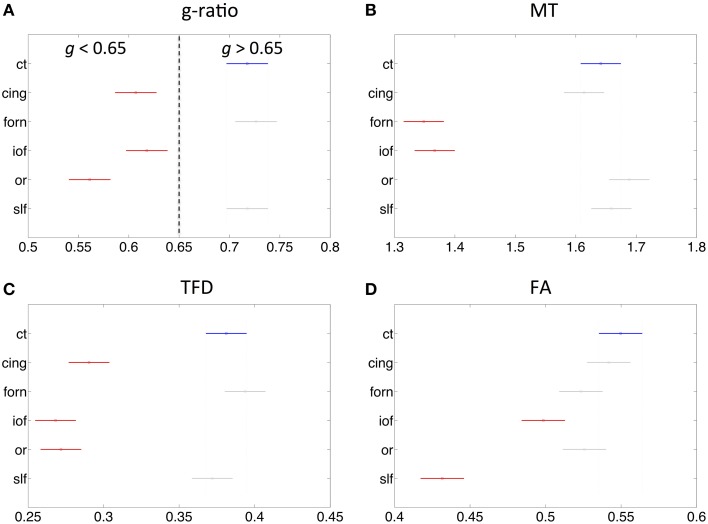
Figure 7.
Comparison of MR g-ratio to the (A) MT (B), TFD (C), and FA (D) values within six fiber tracts (as defined in Figure 6). Tracts in red show significant difference to cortico-spinal tract (blue). There is no obvious simple correspondence between MR g-ratio and the other quantitative MR values in these tracts, indicating that the MR g-ratio provides additional information over and above the other measures.

