
Figure 1. Bland-Altman plots demonstrating the level of agreement between AASM2012 and AASM2007Rec, AASM2007Alt, and AASM1999, respectively.
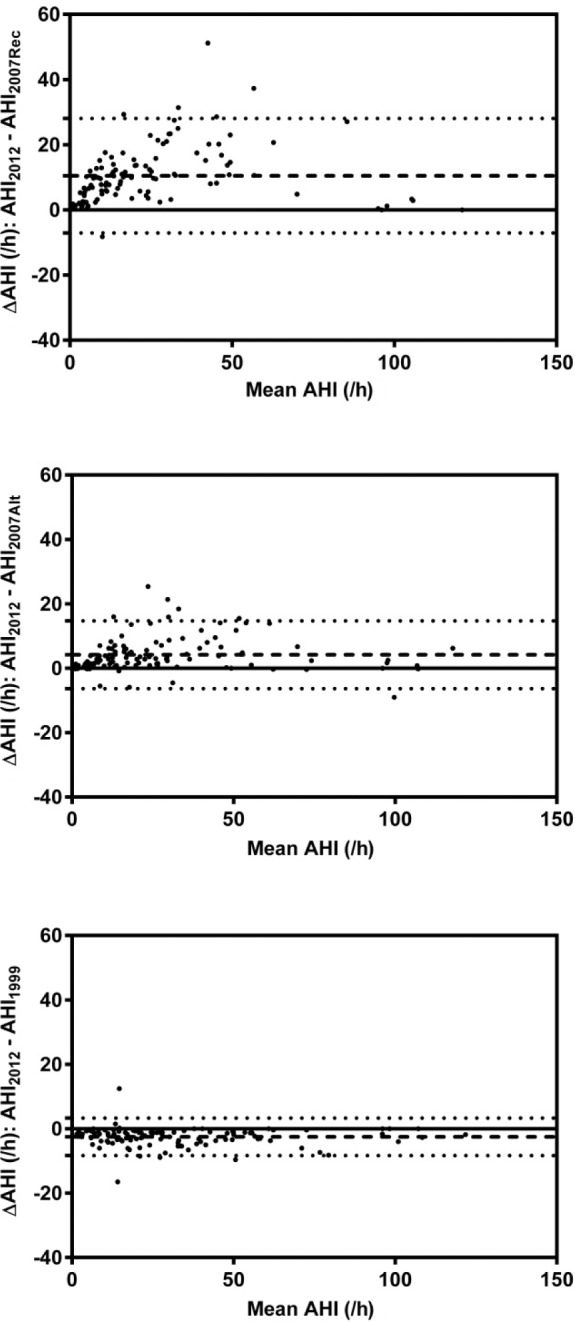
The dashed line represents the mean difference and the dotted lines represent the 95th percentile confidence limits.