
Figure 2. Least squares regression demonstrating the apnea-hypopnea index relationships between AASM2012 and AASM2007Rec, AASM2007Alt and AASM1999, respectively.
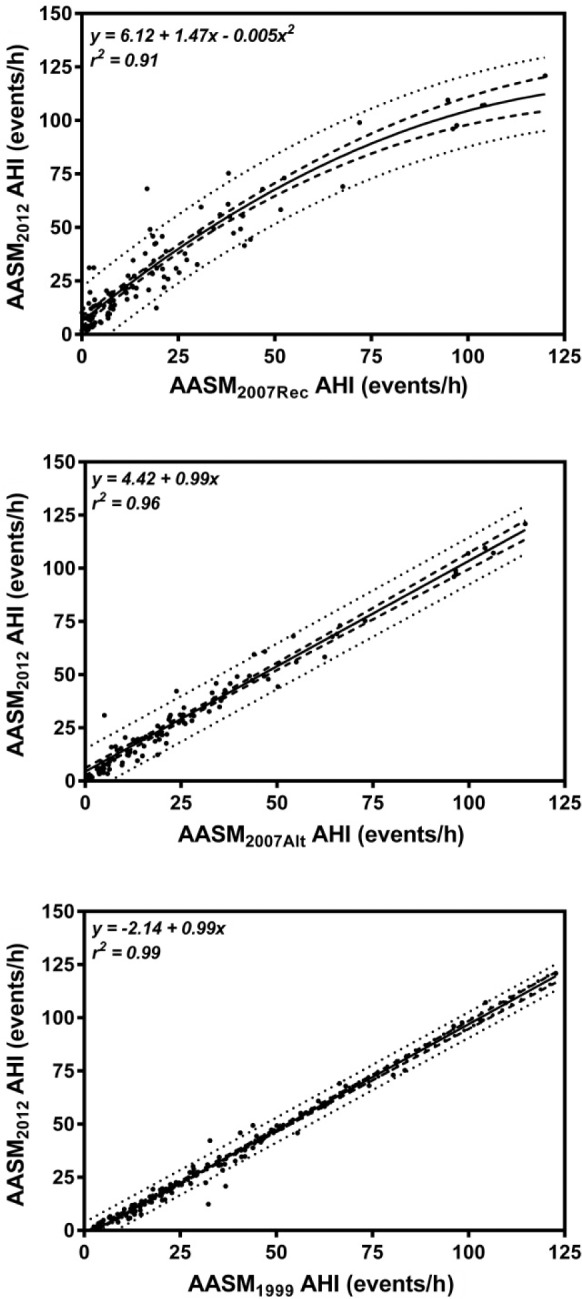
The unbroken line represents the line of best fit while the dashed lines represent the 95th percentile confidence intervals. The dotted lines represent the upper and lower bounds of the prediction interval.