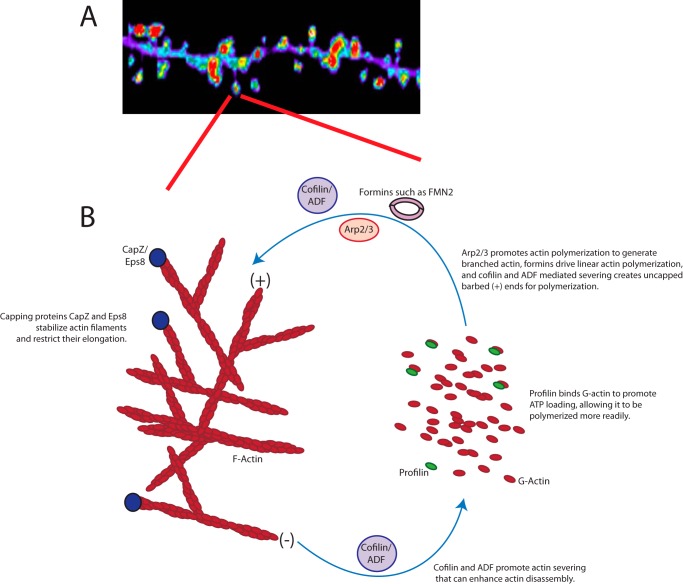
FIGURE 2.
The basics of actin dynamics in the dendritic spine. A, representative image of a dendritic section from a hippocampal neuron expressing GFP-actin. Fluorescent signal is pseudo-colored for relative intensity ranging from low (blue) to high (red). Note that actin is highly enriched in spines protruding from the dendritic shaft. B, schematic depicting actin turnover in dendritic spines and the proteins directly involved in its remodeling. Treadmilling of actin between polymerized F-actin to monomeric G-actin at the barbed (+) versus pointed (−) end is indicated.

