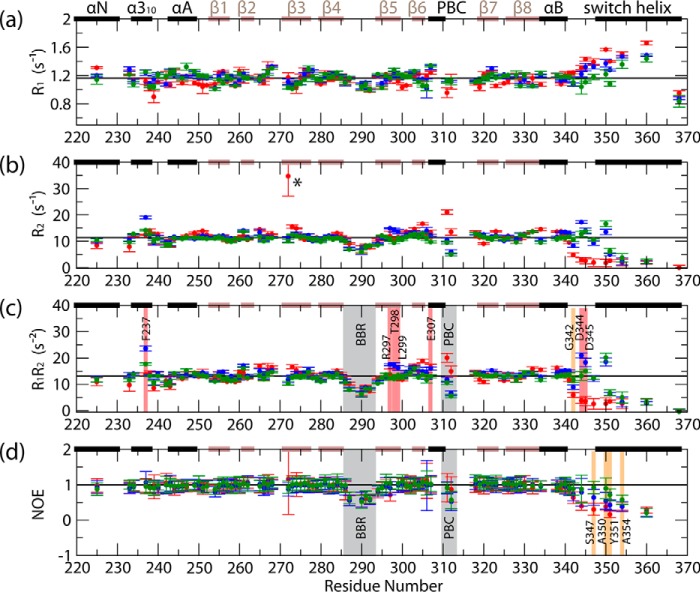
FIGURE 4.
Backbone 15N relaxation rates for apo (red points), cAMP-bound (blue points), and cGMP-bound (green points) PKG Iβ(219–369). a, R1 relaxation rates; b, R2 relaxation rates; c, product of R1 and R2; d, (1H,15N) NOE values, computed as Isat/Inonsat. Black horizontal lines denote the average values computed for the inner β-strands of the β-barrel, which, due to the rigidity of this region of the protein, are assumed to represent the overall tumbling motion of the protein in solution. Residues exhibiting notable enhancements of millisecond-microsecond/picosecond-nanosecond dynamics in cAMP versus cGMP-bound PKG Iβ(219–369) are indicated by red/orange highlights, respectively, while other regions exhibiting notable dynamics are indicated by gray highlights, and an apo-state residue for which the R2 rate could not be properly quantified (due to a poor signal-to-noise ratio) is marked with an asterisk. The secondary structure elements from the apo-state x-ray structure are indicated across the top of each graph (black bars = α-helices, brown bars = β-strands), and residues for which no data are shown are prolines or were not successfully assigned in the relaxation NMR spectra for one or more states.

