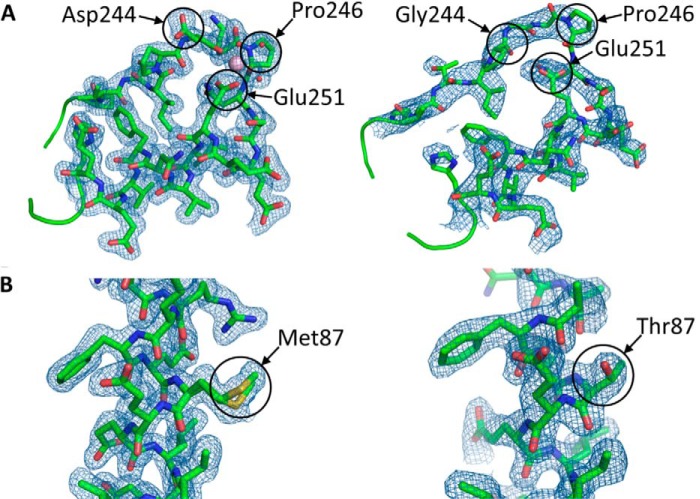
FIGURE 6.
Mutation site electron densities. Crystallographic electron density maps of the D244G (A, right) and M87T mutation sites (B, right), corresponding to residues 240 through 259 and 84 through 98, respectively, compared with wild type hCasq1 (A, left and B, left) are shown. Each electron density map (blue mesh) is a feature-enhanced map generated in PHENIX at a contour of 1.5 σ. The locations of mutated residues and their corresponding wild type residues are indicated.

