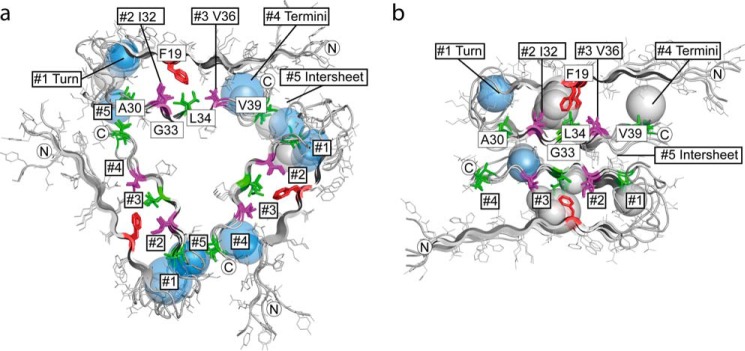
FIGURE 3.
Packing analysis of Aβ structures. a and b, distribution of internal cavities in 3-fold symmetric Aβ1–40 fibrils (PDB code 2LMP, model 1) (54) (a) and 2-fold symmetric Aβ1–40 fibrils (PDB code 2LMN, model 1) (53) (b). Shown is a cross-section perpendicular to the fibril axis. Each cavity is depicted as a sphere. The radius of the sphere corresponds to the average distance from the cavity center to the Aβ van der Waals surface. Water-containing polar cavities are colored in blue and hydrophobic cavities in gray. The approximate position of cavity clusters #1 to #5 is indicated. The protein backbones are depicted as schematics, with side chains drawn as lines. Residues that are as close as ≤6 Å to the 19F atom of sulindac sulfide are highlighted using sticks. Residues Ile32 and Val36, which define cavity clusters, are represented in purple. Ala30, Leu34, and Val39 are shown in green. Phe19 is colored red. Termini are marked with N or C.

