FIGURE 2.
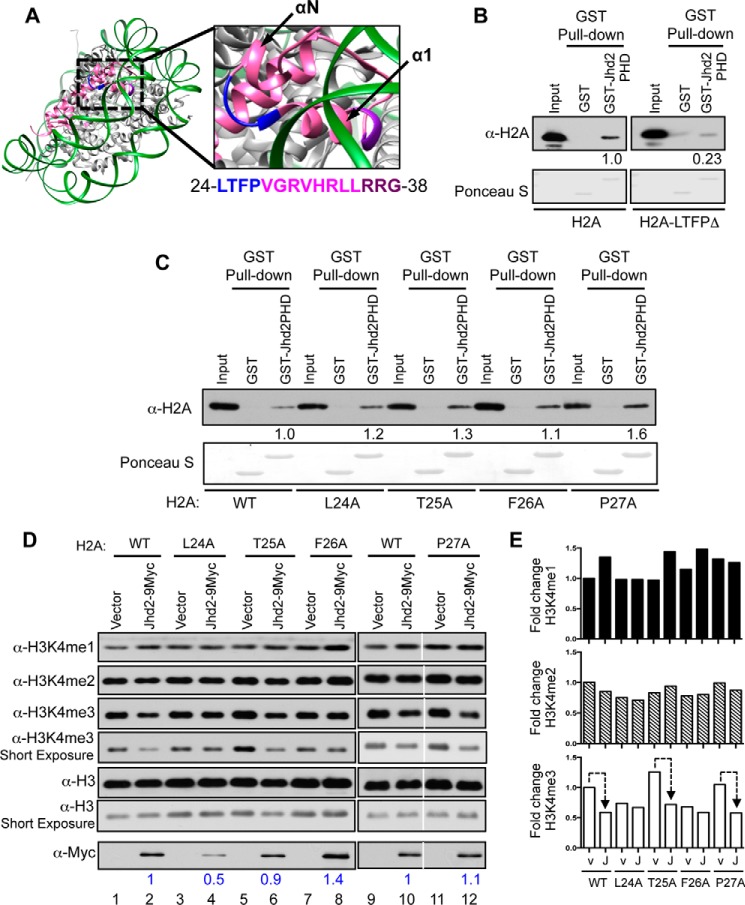
The Phe-26 residue in histone H2A is required for the removal of H3K4me3 marks by Jhd2 demethylase in vivo. A, crystal structure of yeast nucleosome (Protein Data Bank entry 1ID3) is shown together with an enlarged view of a region containing H2A residues involved in interacting with the Jhd2 PHD finger. H2A is shown in magenta; the surface-accessible loop region (residues 24LTFP27) is in blue; and the surface-inaccessible residues of the α1 helix (residues 36RRG38) are in purple. αN and α1 helices are indicated. B and C, recombinant GST alone or the GST-tagged PHD finger was incubated with E. coli lysate containing recombinant H2A or its truncation mutant lacking amino acids 24–27 (H2A-LTFPΔ) (B) or alanine substitution mutants (C) prior to pull-down using glutathione-conjugated beads. After extensive washing, the PHD finger-bound histone was eluted in sample buffer. E. coli lysates (1%, Input) and eluates were subjected to Western blotting using α-H2A antibody. The top part of the blot was stained with Ponceau S to show equal loading of GST and GST-tagged Jhd2 PHD finger. Densitometry signal for the bead-bound histones were normalized to the input control signals. Signal for H2A-LTFPΔ is shown relative to the signal for H2A, which was set as 1. D and E, Western blots for H3K4 methylation and Jhd2 were performed using nuclear extracts from yeast stains expressing either wild-type H2A or the indicated H2A mutant and transformed with an empty plasmid vector (pRS426; v) or a plasmid to overexpress Jhd2 C-terminally tagged with nine copies of the Myc epitope (Jhd2–9Myc; J). H3 served as a loading control. E, blots were quantified by densitometry using ImageJ. Signals for H3K4me1, H3K4me2, H3K4me3, and Jhd2–9Myc in each strain were normalized to the H3 signal. Graphs show -fold change in the normalized signal for an H3K4 methyl mark in various strains relative to that in the control H2AWT strain transformed with vector pRS426, which was arbitrarily set as 1. Dotted line, decrease in H3K4me3 levels upon Jhd2 overexpression. Normalized signals for Jhd2–9Myc in various H2A mutant strains are shown (in blue) relative to its signal in control H2A strain transformed with vector (set as 1).

