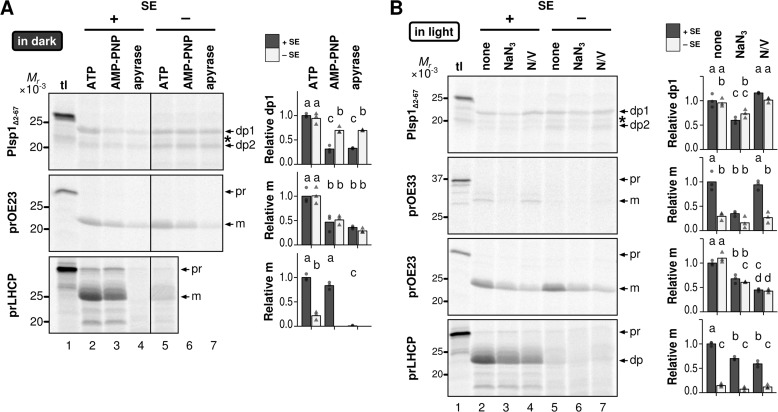
FIGURE 4.
Energy requirement of integration of Plsp1 into isolated chloroplast membranes. A, effects of ATP and ATP depletion. Radiolabeled proteins indicated at left were incubated with isolated chloroplast membranes for 30 min in the dark with (+) or without (−) SE. The transport reactions also contained 5 mm ATP, 5 mm AMP-PNP, or apyrase (1 unit/150 μl). The resultant chloroplast membranes were treated with thermolysin, and the products were separated by SDS-PAGE and analyzed using phosphorimaging. The lanes labeled tl were loaded with 10% of translation products used for the assay. Shown at right are quantifications of transport for three replications of the experiment (circles and triangles) and their means (bars). The results of experiments with SE are depicted with circles and dark gray bars, whereas those without SE are shown with triangles and light gray bars. B, effects of NaN3 and uncouplers. Radiolabeled proteins indicated at left were incubated with isolated chloroplast membranes for 30 min in the light with 5 mm ATP with (+) or without (−) SE. The transport reactions also contained 5 mm NaN3 or 1.5 μm each of nigericin and valinomycin (N/V). The resultant chloroplasts were treated with thermolysin, and the products were analyzed as A. A band between dp1 and dp2 is indicated with an asterisk. It appeared occasionally after thermolysin treatment; when it appeared, its intensity did not vary between treatments. Thus, we did not include it in the analysis.

