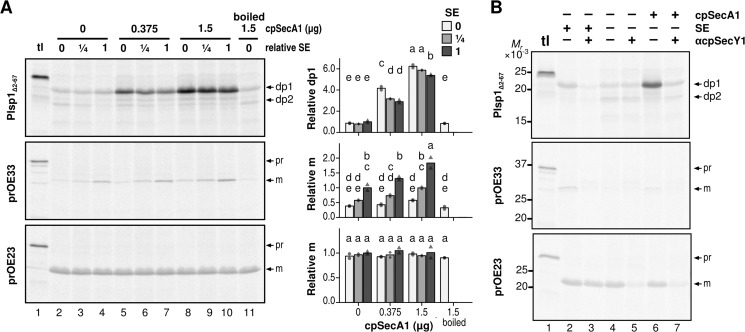
FIGURE 6.
Effects of recombinant cpSecA1 on transport of Plsp1 into isolated chloroplast membranes. A, effects of cpSecA1 and SE. Radiolabeled proteins indicated at left were incubated with isolated chloroplast membranes in the light with 5 mm ATP and varying amounts of SE and recombinant cpSecA1 for 30 min. Analyses of the products were done as described in Fig. 4B. tl lanes were loaded with 10% of translation products used for the assay. To the right are graphs showing quantifications of two repetitions (circles, diamonds, and triangles) and their means (bars) for each treatment. Circles with light gray bars, diamonds with medium gray bars, and triangles with dark gray bars denote specific amounts of SE included in the assay. Letters indicate groupings of treatment with means that do not significantly differ from each other based on Tukey HSD with α = 0.05. Quantifications are relative to transport in the presence of undiluted stroma extract without cpSecA1. B, effects of cpSecA1. SE and the antibody against cpSecY1. Chloroplast membranes preincubated with PBS (αcpSecY1−) or anti-cpSecY1 (αcpSeY1+) were used for the transport assay including radiolabeled proteins indicated at left, 5 mm ATP and without (−) or with (+) SE and cpSecA1 in the light. The resultant products were analyzed as described in the legend to A. Precursor (pr) and mature (m) forms of OE23 and OE33, and thermolysin-resistant fragments of Plsp1 (dp1 and dp2) are indicated to the right.

