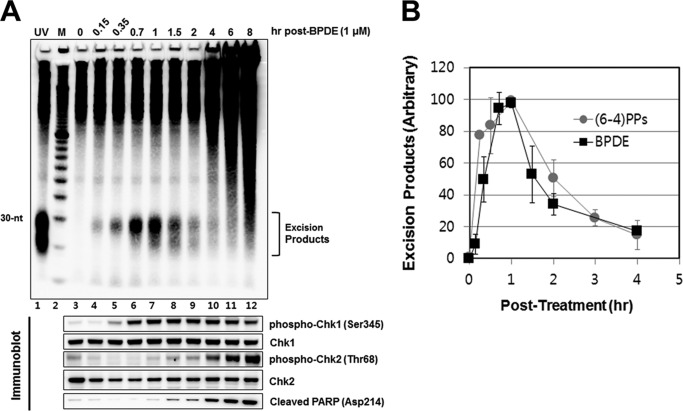
FIGURE 4.
Time-course analysis of excision generation following BPDE treatment. A, HeLa cells were treated with 1 μm of BPDE, harvested at the indicated time points, and then processed for analysis of excised oligonucleotides. Immunoblotting was performed with antibodies against the indicated proteins (bottom). B, quantitative analysis (average and standard deviation) of three independent experiments performed as described in A. The highest BPDE-excision product signal was arbitrarily set to a value of 100 for normalization of the signals from other time points.

