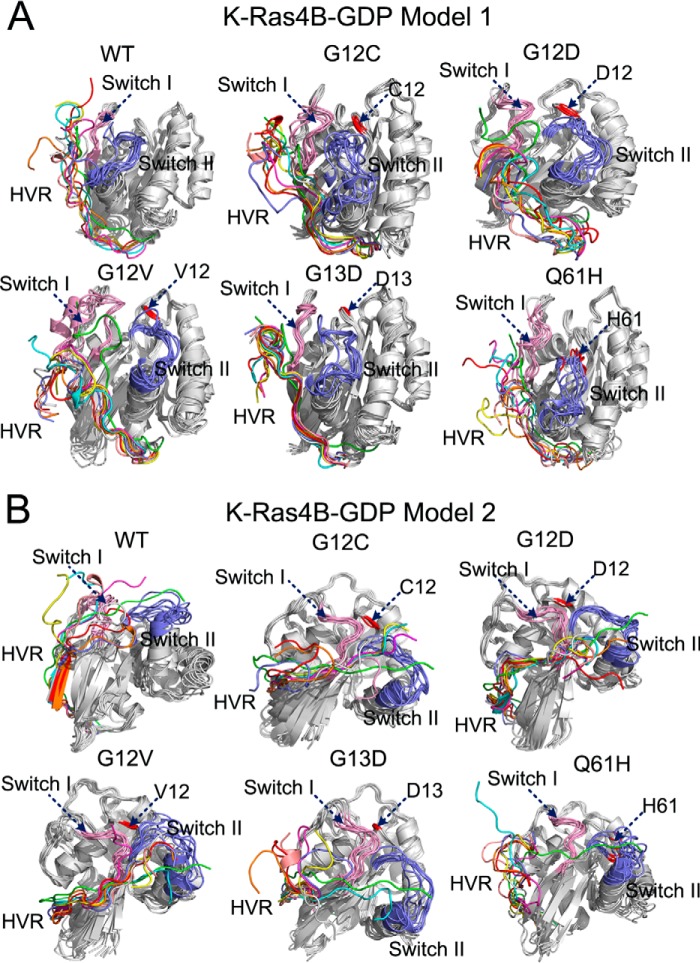
FIGURE 3.
Dynamic behaviors of the HVR in the models 1 and 2 of full-length K-Ras4B-GDP. Backbone superimposition of simulated snapshots sampled at each 25-ns interval over 200 ns of simulation to the initial models 1 (A) and 2 (B) of full-length K-Ras4B-GDP in the wild-type (WT), G12C, G12D, G12V, G13D, and Q61H systems. The different colors of HVR represent the different simulation times of snapshots, initial model (green), 25 ns (cyan), 50 ns (magenta), 75 ns (yellow), 100 ns (pink), 125 ns (gray), 150 ns (blue), 175 ns (orange), and 200 ns (red). The same color settings of the HVR are used for Figs. 7 and 8. The locations of mutation sites are colored in red.

