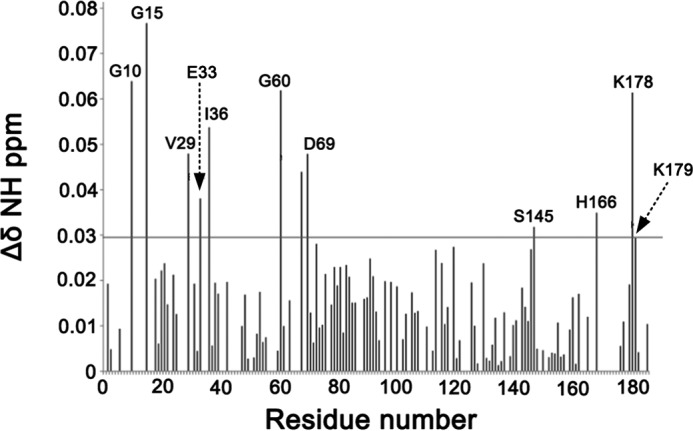
FIGURE 6.

The experimental NMR CSPs for K-Ras4BG12D-GDP. Residual chemical shifts obtained after the overlay of 1H,15N HSQC NMR spectra of K-Ras4BWT-GDP and that of K-Ras4BG12D-GDP. The horizontal line in the graph shows the sum of mean CSP and S.D. The CSPs above the horizontal line are considered significance.
