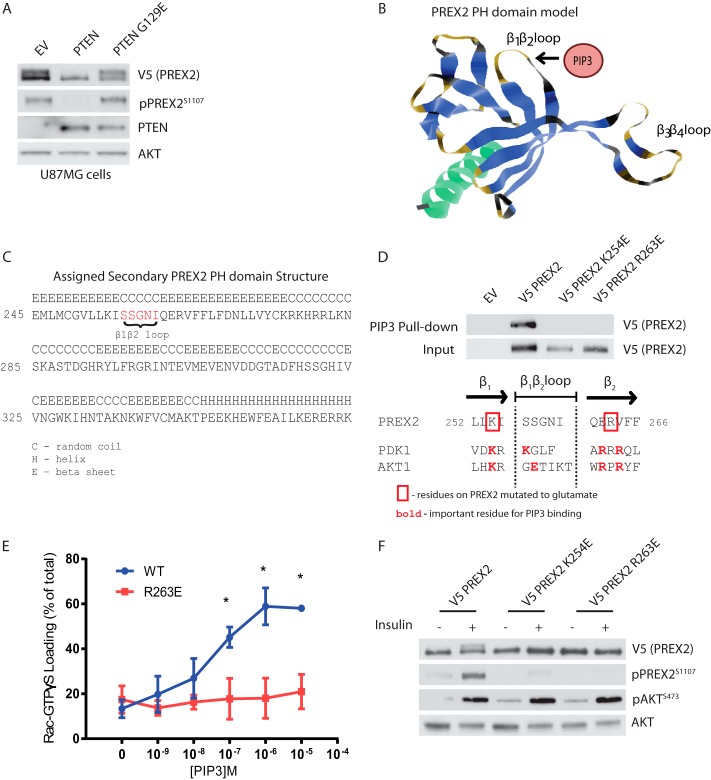
FIGURE 3.
Phosphorylation of PREX2 downstream of insulin requires PIP3 binding. A, Western blot analysis of U87MG cells expressing V5 PREX2 and either PTEN WT or the lipid phosphatase dead mutant PTEN G129E. EV, empty vector. B, ribbon diagram of the PREX2 PH domain model with the putative PIP3 binding region identified. C, predicted secondary structures of the PREX2 PH domain from model. D, top, Western blot analysis of PIP3 pulldowns from HEK293 cells expressing either V5 PREX2 WT, K254E, or R263E. Bottom, diagram showing the β1β2 loop region of the PREX2 PH domain model aligned with the same region on PDK1 and AKT1. E, V5 PREX2 WT or R263E was purified from HEK293 cell lysates, and the ability of increasing doses of PIP3 to stimulate PREX2 GEF activity toward GST Rac1 was assessed in an in vitro GEF assay. Data are mean ± S.D. for at least two experiments with samples done in duplicate at each PIP3 concentration, and * represents p < 0.001 by t test. F, Western blot analysis of starved or insulin-treated HEK293 cells expressing V5 PREX2 WT, K254E, or R263E.

