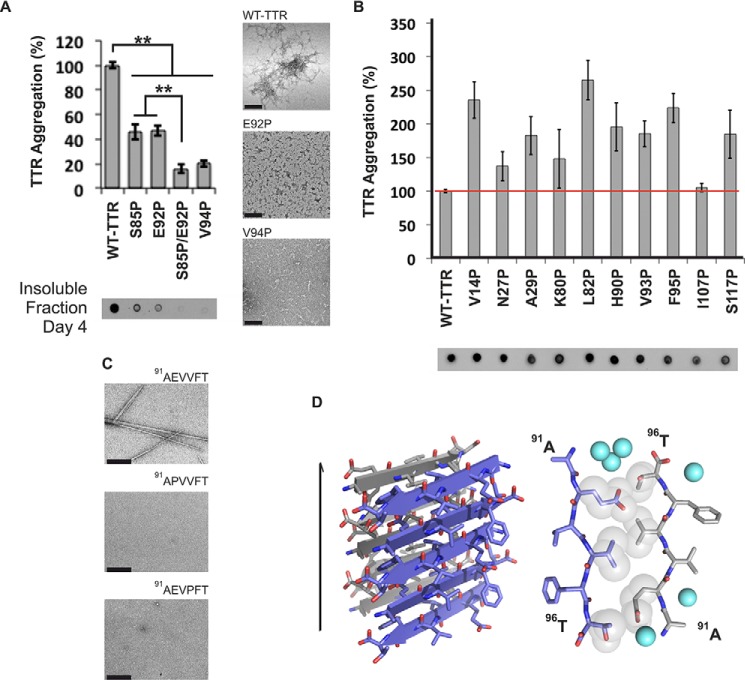
FIGURE 2.
β-Strand F as an aggregation-driving segment in TTR suitable for aggregation inhibitor design. TTR aggregation of the protein variants that showed significant delay (A) and those that did not decrease protein aggregation (B) is shown. Those TTR proline variants that are not shown here were found to be insoluble. Histograms show percentage of TTR aggregation using WT TTR to normalize to 100%. The aggregation was measured by absorbance of the samples at 400 nm after 4 days of incubation at 37 °C and pH 4.3 with no shaking. The bottom panel shows a His probe dot blot of the insoluble fraction corresponding to the sample above after solubilization with guanidinium hydrochloride. On the right are TEM micrographs of protein aggregates (scale bar, 100 nm) after 7 days of incubation. Notice that the proline substitutions within or next to β-strand F hindered TTR aggregation. Several of the other proline substitutions enhanced aggregation; these, like ATTR familial mutations, may alter native structure and/or protein stability (8). Error bars represent S.D., and ** symbolizes a p value ≤0.003 (n = 3). C, TEM micrographs of peptides in isolation after 7 days of incubation in PBS with no shaking (scale bar, 500 nm). D, crystal structure of the segment 91AEVVFT96 from β-strand F forming a Class-7 steric zipper. One sheet is shown as blue; the other is shown as gray. On the left is a lateral view of the fibril with the fibril axis shown by the narrow black arrow. On the right is the view down the fibril axis showing two β-sheets in projection. Water molecules are shown as aquamarine spheres. Spheres represent the van der Waals radii of the side chain atoms of the tightly packed fibril core.

