FIGURE 2.
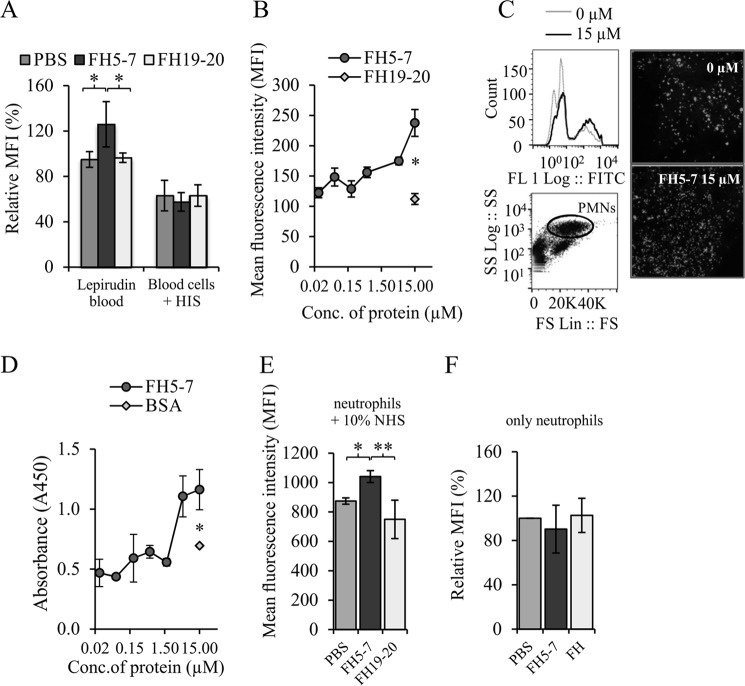
A, phagocytosis of fluorescein-labeled bacteria by neutrophils was tested ex vivo in lepirudin-anticoagulated blood and lepirudin-anticoagulated blood with HIS (n = 2). B, dose-dependent effect of FH5–7 on S. aureus phagocytosis ex vivo (n = 3). C, analysis of fluorescence-labeled (FL) bacteria associated with blood cells (right panel) and neutrophils (left panel) in the ex vivo assay. Gated neutrophils (left panel above) were analyzed for fluorescence intensity, and the distribution of the fluorescent cells in the presence (15 μm) and absence (0 μm) of FH5–7 were visualized in a histogram (upper left panel). Blood cells (right panel) under confocal microscopy in the (15 μm) presence and (0 μm) absence of FH5–7. D, dose-dependent effect of FH5–7 on plasma C3a formation ex vivo. After incubating the bacteria in blood the formation of C3a on plasma was calculated (n = 2). Phagocytosis of fluorescein-labeled bacteria in vitro is shown. The labeled bacteria were incubated with neutrophils both in the presence (E) or absence (F) of fresh 10% serum (n = 3). In the assays, FH19–20, BSA, or FH were used as a negative controls. Mean fluorescence intensity (MFI) was counted from 10,000 (blood cells in NHS or HIS) or 2,000 neutrophils using flow cytometry. The relative mean fluorescence intensity is counted as the percentage of the mean fluorescence intensity of PBS sample obtained in repetitive assays. Error bars show ±S.D. (B, D, and E) or 95% (A) confidence intervals. The asterisks (* and **) indicate a p value below 0.05 or 0.01 obtained using Student's t test (B and D) and one-way analysis of variance (A and E) supplemented with Tukey's multiple comparison test.

