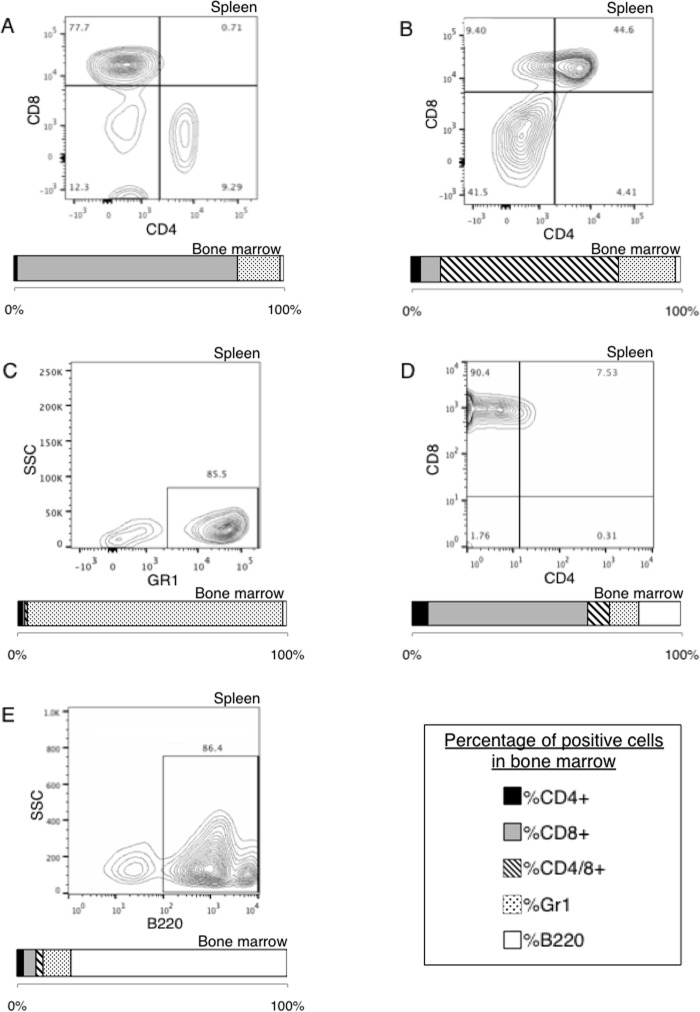
FIGURE 10.
Expression of JAK3 mutants in bone marrow cells of Balb/c mice leads to distinct leukemia phenotypes. Spleen and bone marrow cells of diseased animals were analyzed by flow cytometry with anti-CD4, anti-CD8, anti-Gr1, and anti-B220 antibodies. Cells were gated for GFP expression. FACS analysis representative of a CD8+ T-lymphoproliferation in a JAK3V674A mouse (A), a CD4/8+ T-lymphoproliferation in a JAK3L857P mouse (B), a Gr1+ myeloproliferation in a JAK3L857P/Y100A mouse (C), a CD8+ T-lymphoproliferation in a JAK3L857P/Y100A mouse (D), and a B220+ B-lymphoproliferation in a JAK3L857P mouse (E) are shown, either as dot plots (spleen) or as stacked column charts representing the percentage of cells positive for the different markers (bone marrow).

