
FIGURE 3.
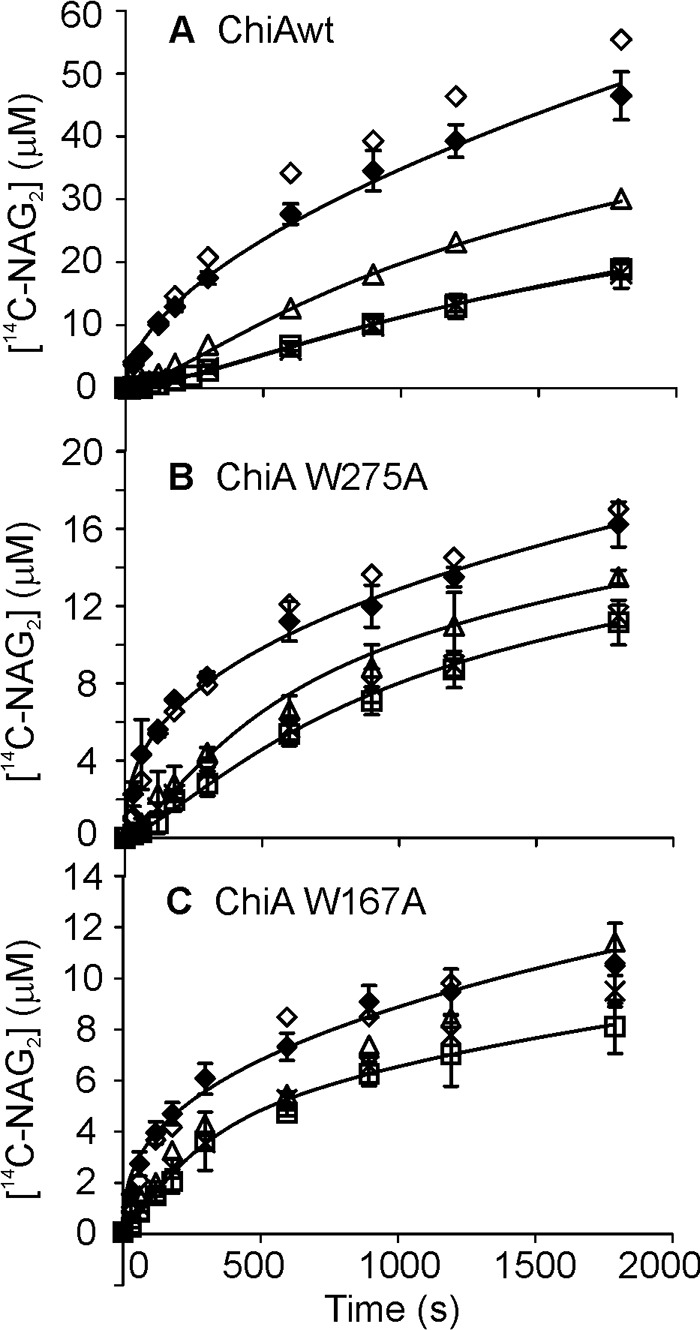
SEE with α-chitin. α-Chitin (4 mg ml−1) was pre-incubated with 20 nm ChiA for 10 min (▵), 2 h (□), or 24–360 h (×), after which an equal volume of 14C-CNWs (final concentration 1 mg ml−1) was added, and the release of 14C (expressed in NAG2 equivalents) in time was followed. In the control experiments (♢), 14C-CNWs (1 mg ml−1) was incubated with 10 nm ChiA or (♦) the mixture of 14C-CNWs (1 mg ml−1) and α-chitin (2 mg ml−1) was incubated with 10 nm ChiA. Error bars show S.D. and are from three independent experiments. Solid lines represent the best fit according to Equation 1 (control) or Equation 2 (SEE). A, wild type ChiA; B, ChiA-W275A; C, ChiA-W167A.