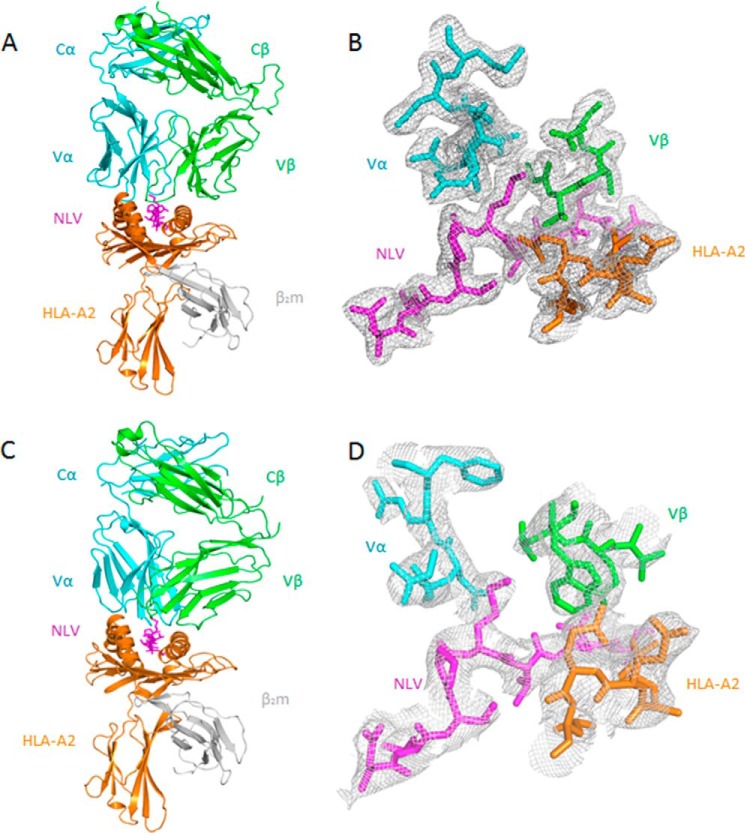
FIGURE 2.
Structure of TCR·NLV·HLA-A2 complexes. A, side view of the C25·NLV·HLA-A2 complex (ribbon diagram). Cyan, TCR α chain; green, TCR β chain; orange, HLA-A2 heavy chain; gray, β2 microglobulin (β2m); magenta, NLV peptide. B, electron density in the interface of the C25·NLV·HLA-A2 complex. Density from the final 2Fo − Fc map at 2.1 Å resolution is contoured at 1σ. C, side view of the C7·NLV·HLA-A2 complex. D, electron density in the interface of the C7·NLV·HLA-A2 complex. Density from the final 2Fo − Fc map at 3.5 Å resolution is contoured at 1σ.

