
Figure 2. Effects of CACNA1C genotype on the number of errors.
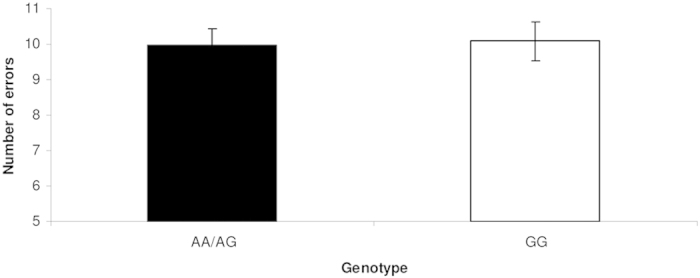
The number of errors is shown for the two genotype groups. CACNA1C genotype had no effect on the number of errors. **p ≤ 0.01, error bars represent standard error of the mean.
Official websites use .gov
A
.gov website belongs to an official
government organization in the United States.
Secure .gov websites use HTTPS
A lock (
) or https:// means you've safely
connected to the .gov website. Share sensitive
information only on official, secure websites.
The number of errors is shown for the two genotype groups. CACNA1C genotype had no effect on the number of errors. **p ≤ 0.01, error bars represent standard error of the mean.