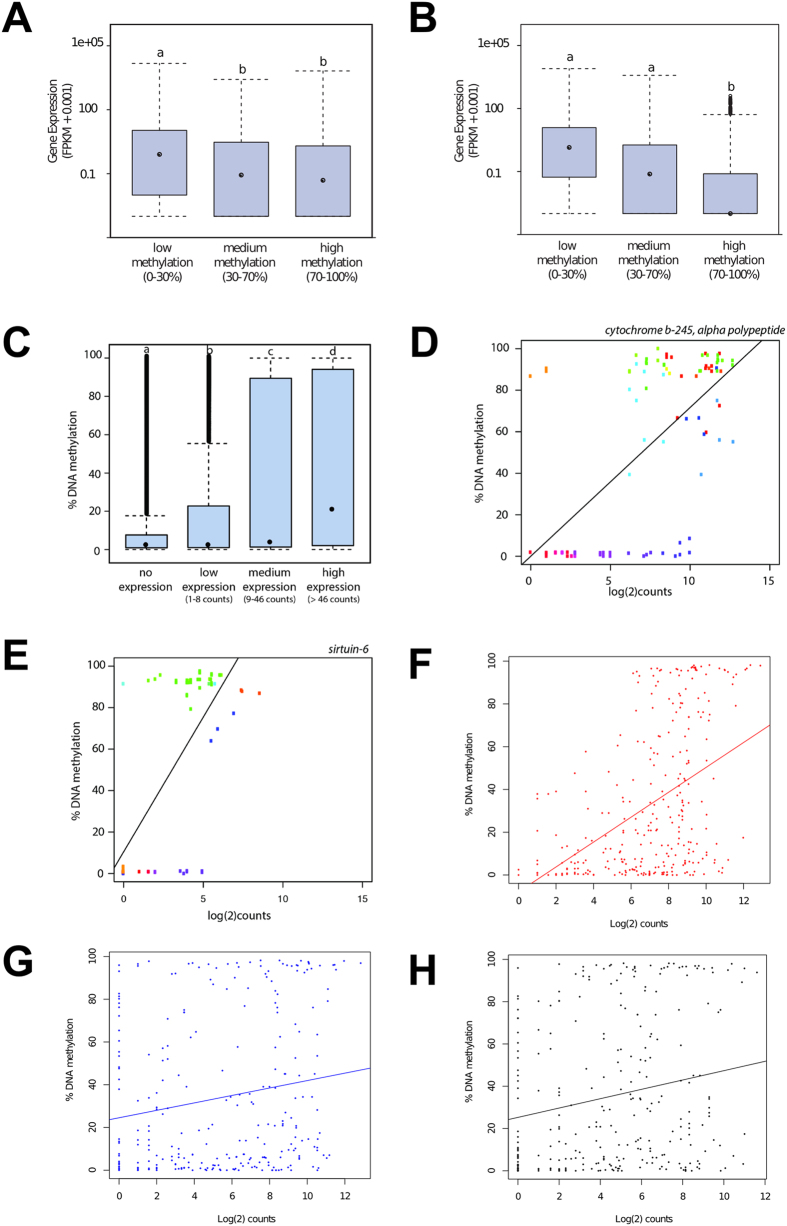
Figure 5. DNA methylation and gene expression relationship.
Methylation of CpG island cores (A) and promoters (B) negatively associated with gene expression (y-axis, plotted as fragment per kb per million reads or FPKM). Bars that do not share a letter are significantly different. For (B), DNA methylation of 0 to + 500 bp region (downstream) from transcriptional start site was plotted against expression (see more details in Supplementary Table S7). (C) Expression of individual exons is positively correlated with DNA methylation on that exon. For significance tests in the above figures, ANOVA with a Tukey HSD post-hoc test was used and P < 0.05 was considered significant). (D–E) Two examples of positive correlation between individual exon methylation and gene expression (log 2 of read counts for the exons were plotted in x-axis): cytochrome b-245 alpha polypeptide (CYBA) (r = 0.68 and P = 8.3 × 10⁻⁹) and sirtuin6 (SIRT6) (r = 0.67 and P = 7.5 × 10⁻⁵) genes. (F) Methylation and expression of 78 exons where iVMFs directly overlapped differentially expressed exons, (G) exons upstream to these directly overlapped iVMFs and (H) exons downstream to these directly overlapped iVMFs.

