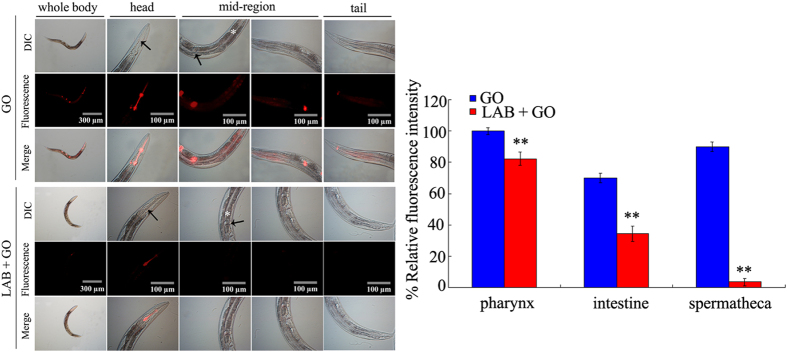
Figure 3. GO distribution in wild-type nematodes.
GO-Rho B was used to visualize the distribution of GO in nematodes. The arrowheads indicate the pharynx and spermatheca, respectively, at the head region or mid-region of nematodes. The intestine (*) in the mid-region was also indicated. GO-Rho B exposure concentration was 100 mg/L. The used LAB strain was L. bulgaricus. L4-larvae were pre-treated with LAB for 12 h, and then exposed to GO-Rho B for 24 h at 20 °C. Bars represent means ± S.E.M. **P < 0.01 vs GO.

