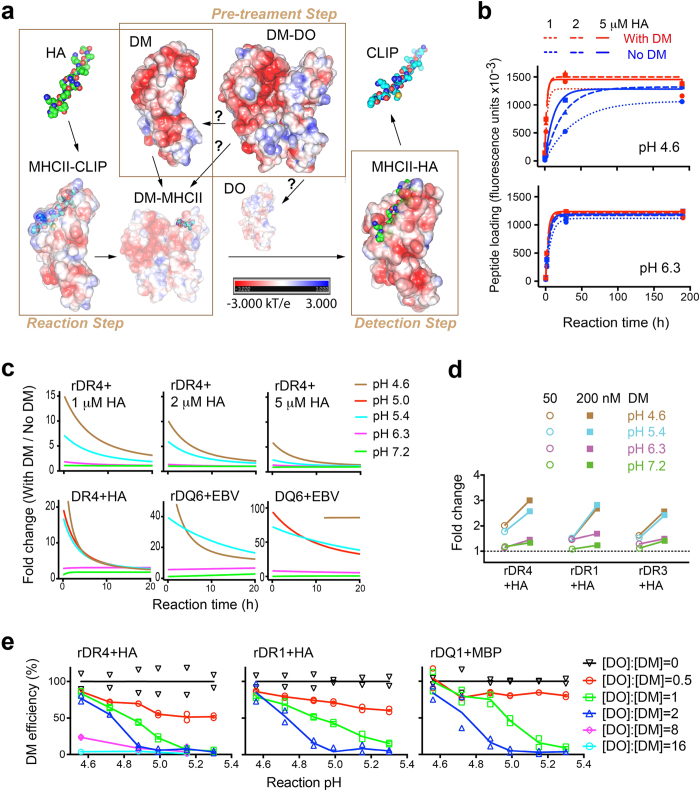
Figure 1. pH affects peptide exchange, DM catalysis and DO inhibition.
(a) Immunoassays allow assessment of peptide loading in three separated steps each containing multiple pH-sensitive processes, denoted by arrows. Question marks indicate undefined mechanisms. Shown are electrostatic potential surfaces of each structure (PDB: 1HDM, 4I0P, 4FQX, 3PDO, and 1DLH). (b) Recombinant DR4 (5 nM) was incubated with indicated concentrations of HA306–318 peptide in the presence or absence of soluble DM (200 nM) at the indicated pH for different reaction times, followed by measurement of DR4-HA complexes quantified as fluorescence units and indicated as peptide loading. Data were fit to a kinetic model (see Methods) (c) Fold difference between peptide loading (HA306–318 to DR4 or EBV490–503 to DQ6, r: recombinant; f: full length) with and without DM at each pH was calculated (first 20 h), based on the fitted curves from (b) or (Supplementary Fig. 1). (d) HA loading to different DR allelic proteins with various concentrations of DM was carried out for 1.5 h at the indicated pH (detailed in Supplementary Fig. 2a) and was normalized to individual allelic baseline (corresponding pH conditions without DM) and expressed as fold change. (e) Peptide loading (HA306–318 to DR proteins or MBP86–99 to DQ1) at different reaction pHs was performed with various [DO]:[DM] (detailed in Supplementary Fig. 2c), normalized to corresponding reactions with DM alone after subtraction of individual allelic baselines, and represented as DM efficiency. [DO]:[DM] = 0 indicates DM only. The mean of duplicates is shown (a–d) or both replicates are shown (e). All data are representative of two experiments.

