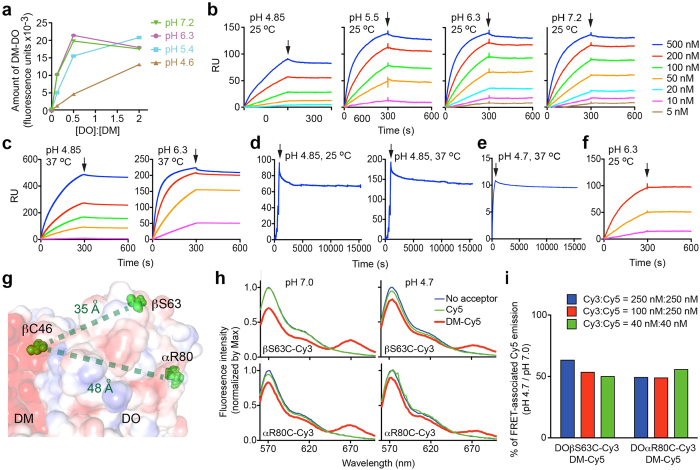
Figure 2. pH influences DO/DM interaction.
(a) Different ratios of soluble DOv/DM proteins were incubated at the indicated pH for 1.5 h before the measurement of DM-DOv complexes by capture ELISA (see Methods). (b,c) SPR (BIAcore) analysis of binding of DOv injected at indicated concentrations to immobilized DM under indicated conditions. Arrows indicate the end of DOv injection and the beginning of dissociation. (d) A single cycle mode with extended dissociation (>4 h after the arrow) was selected to monitor dissociation of DM-DOv complexes formed on the BIAcore sensor at indicated conditions. (e) Dissociation of DM-DOwt complexes analyzed by BLI (Octet OK) at the indicated condition. (f) Intact DOv SEC-purified after pH 4.6 pulses (Supplementary Fig. 4) was analyzed by SPR for DM binding at the indicated condition and colored as in (b). (g) Illustration of sites (red spheres) used for mutagenesis and/or dye labeling, with interatomic distances as indicated. PDB code: 4I0P. (h) FRET analysis of donors: 250 nM of Cy3-labeled proteins (DO mutants-Cy3) or buffer, and acceptors: 250 nM of Cy5-labeled protein (DM-Cy5) or equivalent free Cy5 or buffer, at indicated pHs. Emission spectrum was normalized by the maximum (~570 nm) donor emission after background (acceptor alone) correction. (i) Integrals (the area under the curve) of FRET-associated Cy5 emission in (h) were calculated. Shown is the ratio of the integral at pH 4.7 to that at pH 7.0. The mean of duplicates is shown (a,h). Data are representative of two (a–f) or three (h) experiments. Temperature effects on BIAcore sensor surfaces besides pH effects significantly contributed to RU, but had no influence on measurements of KD, app (Supplementary Table. 1).

