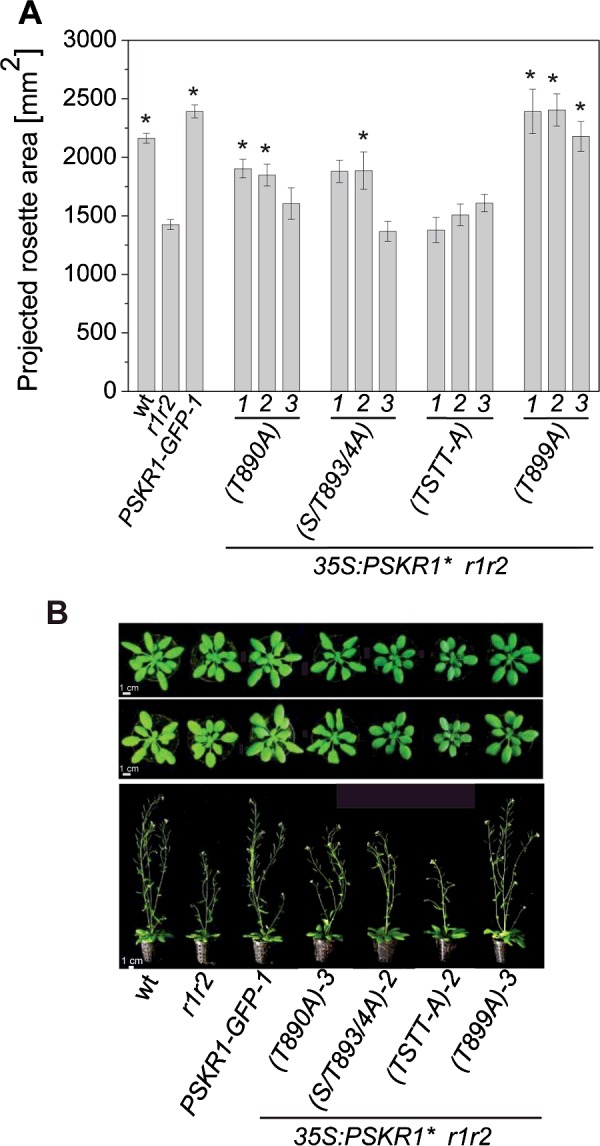
Figure 6. Preventing phosphorylation of specific activation segment residues impairs shoot growth.

(A) The mean±S.E.M. projected rosette area from PSKR1(T890A), PSKR1(S893A/T894A), PSKR1(T899A) and PSKR1(TSTT-A) plants (n=8–9) was calculated using the program Rosette Tracker [28]. Wild-type plants and plants complemented with a GFP-tagged wild-type receptor in the receptor-null background were included as controls. Asterisks indicate significantly different values between r1r2 and the receptor variants (P<0.05, two-sample Student's t test). (B) Representative phenotypes of 4-week-old (upper row) and of 6-week-old (lower row) soil-grown plants from wild-type, r1r2, 35S:PSKR1-GFP-1, 35S:PSKR1(T890A)-3, 35S:PSKR1(S893A/T894A)-2, 35S:PSKR1(TSTT-A)-2 and 35S:PSKR1(T899A)-3. Scale bars, 1 cm. S/T893/4A, S894A/T894A; wt, wild-type.
