
Figure 3. MI192 affects microtubule dynamics.
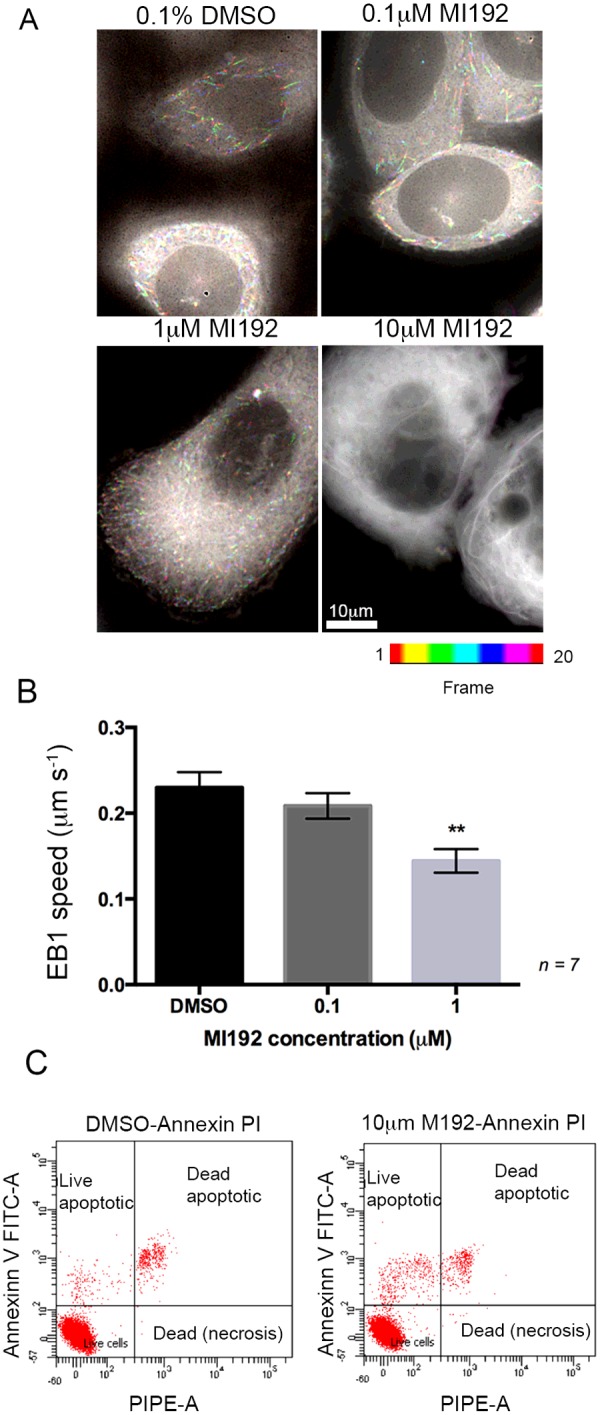
(A) Images of cells expressing eGFP–EB1, after treatment with 0.1, 1 or 10 μM MI192 for 1 h. Images were captured every 2 s, for a total of 40 s (a total of 20 frames). The images shown were generated from the image sequences using ImageJ Fiji, and the temporal-colour code plug, to show the lengths of the tracks and how they vary between the different conditions. The colour code reference is shown below the images. (B) Speed of EB1 spots, tracked for seven cells. Means ± S.E.M. are shown. **P< 0.01. (C) Flow cytometry analysis using FITC–annexin V and propidium iodide to estimate apoptosis (live and dead cells) and necrotic cells with or without 10 μM MI192 treatment.