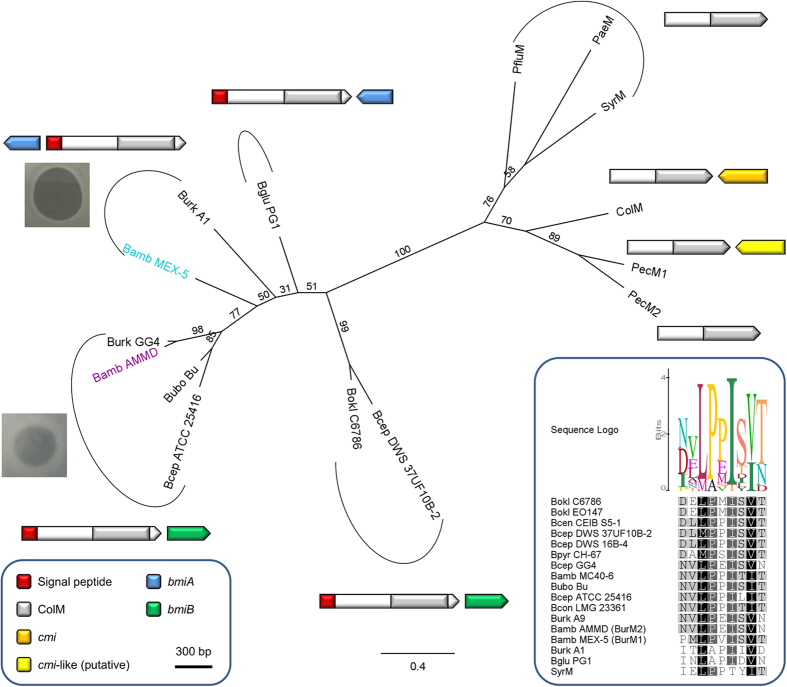
Figure 2. Phylogeny of ColM domains in burkhocins and γ-proteobacterial bacteriocins.
Maximum likelihood phylogenetic tree of ColM domains of selected Burkholderia BurMs, E. coli ColM, Pectobacterium PecMs, P. aeruginosa PaeM, P. fluorescens PfluM, and P. syringae SyrM. Burkholderia species abbreviations are the same as in Fig. 1. Bamb MEX-5 (BurM1) and Bamb AMMD (BurM2) are shown in teal and purple, respectively. The bacteriocin activity of BurM1 against LMG 18829 (clear halo) and of BurM2 against LMG 18943 (turbid halo) in spot assays is illustrated. Scale bar represents 0.4 substitutions per site. Bootstrap values (percentages of 1000 replicates) are shown at the branches. Schematic gene organizations of bacteriocins and (putative) associated immunity genes are displayed next to the clades or branches (delimited by arcs). The arrows correspond with the gene orientations. For pectocin M2 and pseudomonad ColM-like bacteriocins, no adjacent immunity genes have been described. The color legend (box with scale bar, bottom left) describes the indicated domains and signal peptide sequences. Predicted signal sequences in the immunity genes, if present, are not shown. Sequence alignment of the conserved region following the signal sequence in BurMs and in SyrM is shown as inset (bottom right). Shading reflects the degree of conservation. The sequence logo graph visualizes the degree of consensus for each position.

