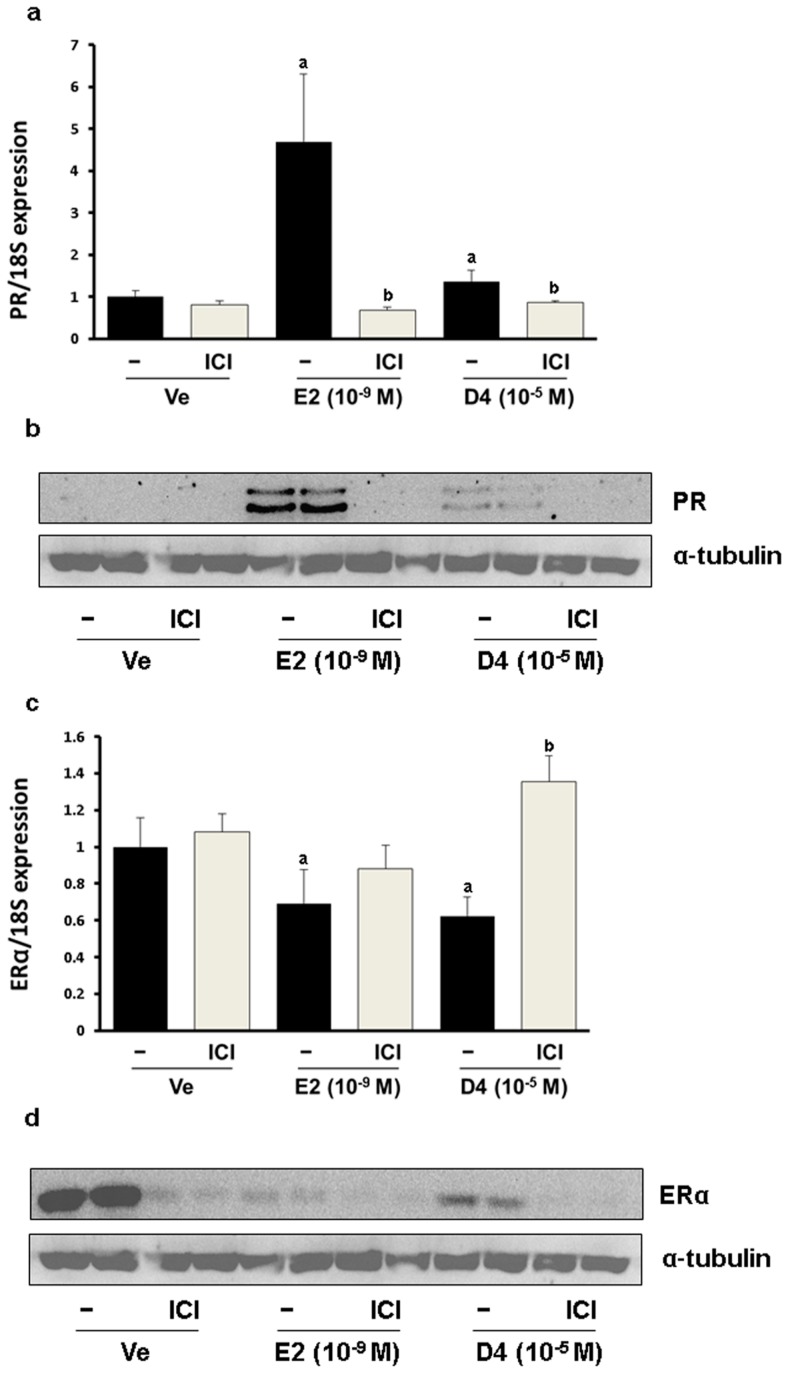
Figure 2.
PR expression in GH3 cells at the mRNA (a); and protein (b) levels; ER α expression in GH3 cells at the mRNA (c); and protein (d) levels. Results presented in the bar graph are divided according to chemical administered and subdivided according to the presence or absence of ICI 182 780 (shown as ICI). a p < 0.05 versus vehicle; b p < 0.05 versus without ICI. Data are presented as the mean ± SD.

