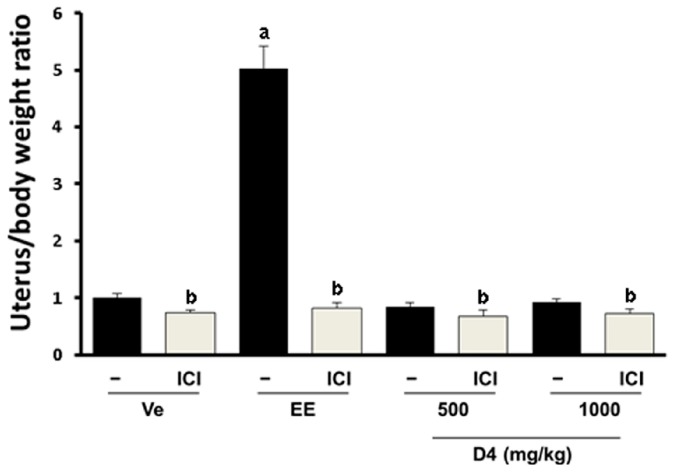
Figure 4.
Uterus/body weight ratio measured by the UT assay in immature female SD rats. Results in the graph are divided according to the chemical administered and subdivided according to the presence/absence of ICI 182 780 (shown as ICI). a p < 0.05 vs. vehicle; b p < 0.05 vs. without ICI. Data are presented as the mean ± SD.

