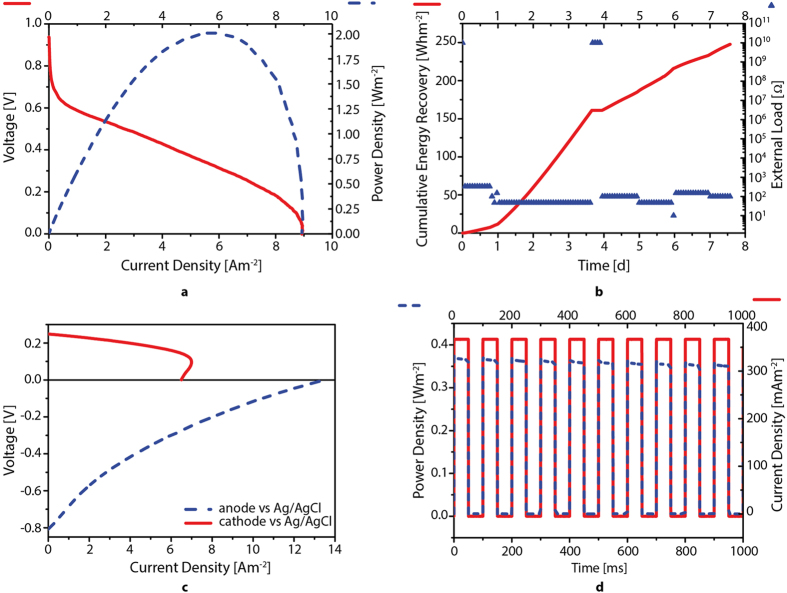
Figure 3. Electrical characterization of AM manufactured MFCs.
From top to bottom, from left to right: (A) polarization curve (Voltage vs current density curve) and power density curve of MFC; (B) total energy recovered in a week by MFC under external loads (from 820 to 10 Ω, open circuit condition 1010 Ω); (C) polarization curve of both semicells (anode and cathode); (D) pulsed power density, at fixed currents of either 412 ± 1 mA m−2 or 0 mA m−2.

