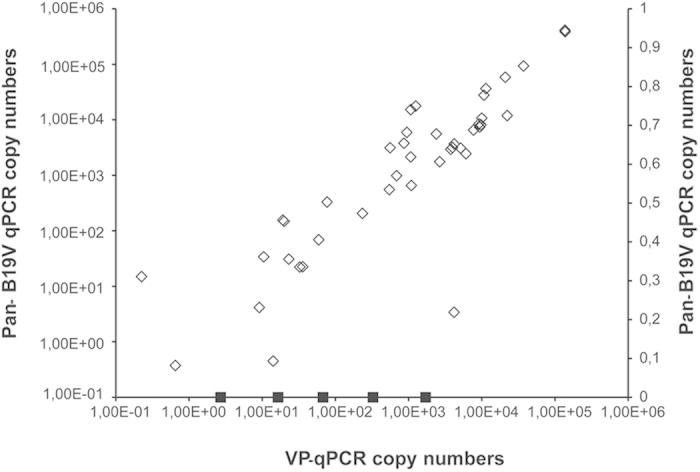
Figure 1. Correlation of B19V DNA copy numbers determined by Pan-B19V and VP qPCRs.

Genomic B19V DNA was quantified by means of two in-house quantitative PCRs targeting distinct conserved regions of the viral genome (NS and VP). Represented are in the y-axis the genomic copies/1 μg of total DNA of individual samples as determined by the Pan-B19V qPCR. In the x-axis, genomic copies/1 μg of total DNA of individual samples as determined by VP-qPCR. In squares are represented the copy numbers of the five samples that were positive by the VP-qPCR only.
