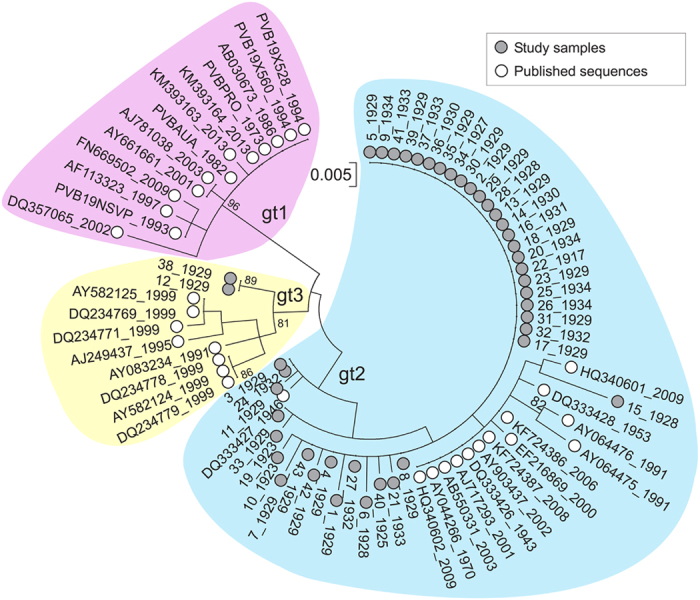
Figure 2. B19V phylogenetic tree.

Maximum likelihood tree of the combined NS/VP region constructed using optimal substitution models (Kimura 2-parameter + invariant sites). Sample dates (acute infection; plasma) or predicted infection dates (assumed at 9 years of age; tissue) are shown on labels. Bootstrap re-sampling was used to determine robustness of groupings; values of 70% or greater shown.
