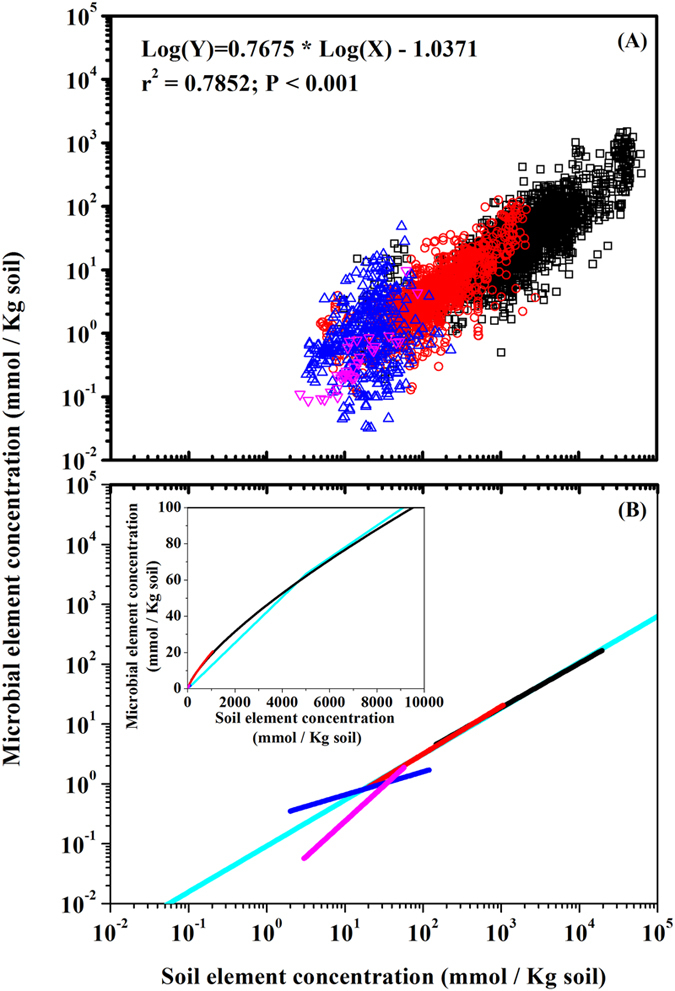
Figure 2.

(A) Relationship between microbial element concentrations and soil element concentrations ( represents carbon (C),
  represents nitrogen (N),
  represents P,
  represents S) (B) The homeostatic regulation of element concentrations across C, N, P, and S. Inset shows full range of homeostatic regulation (Note: inset has linear x-axis and y-axis. Shallow blue for equation across C, N, P, and S; black is for C, Log(Y) = 0.7391 × Log(X)−0.9407; r2 = 0.62; red for N, Log(Y) = 0.7939 × Log(X)−1.087; r2 = 0.58; blue for P, Log(Y) = 0.3868 × Log(X)−0.5698; r2 = 0.05; and pink for S, Log(Y) = 1.1886 × Log(X)−1.8123; r2 = 0.76; all regressions are significant at level of P = 0.05)
