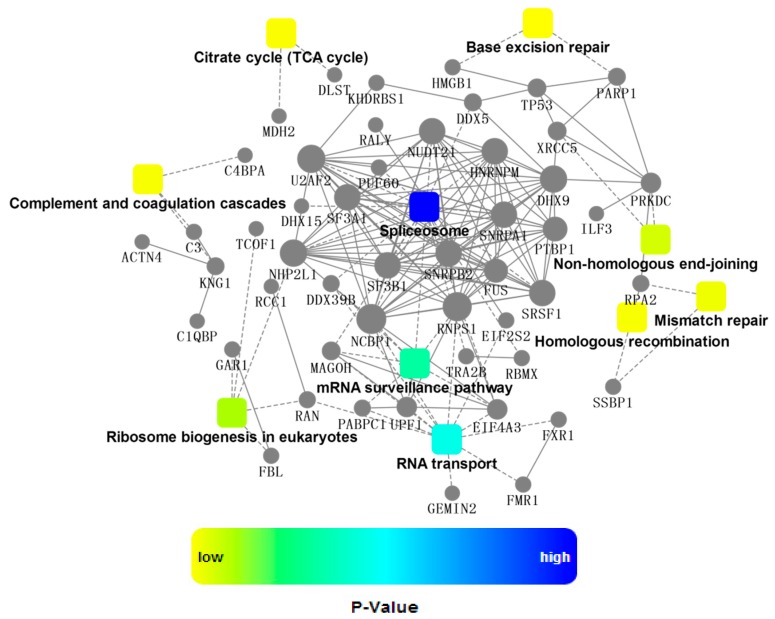
Figure 6.
A network of protein-protein interaction (PPI). The PPI analysis was based on fold change of gene/protein, protein-protein interaction, KEGG pathway enrichment and biological process enrichment. Circle nodes refer to genes/proteins. Rectangle refers to KEGG pathway or biological process, which were colored with gradient color from yellow (smaller p-value) to blue (bigger p-value).

