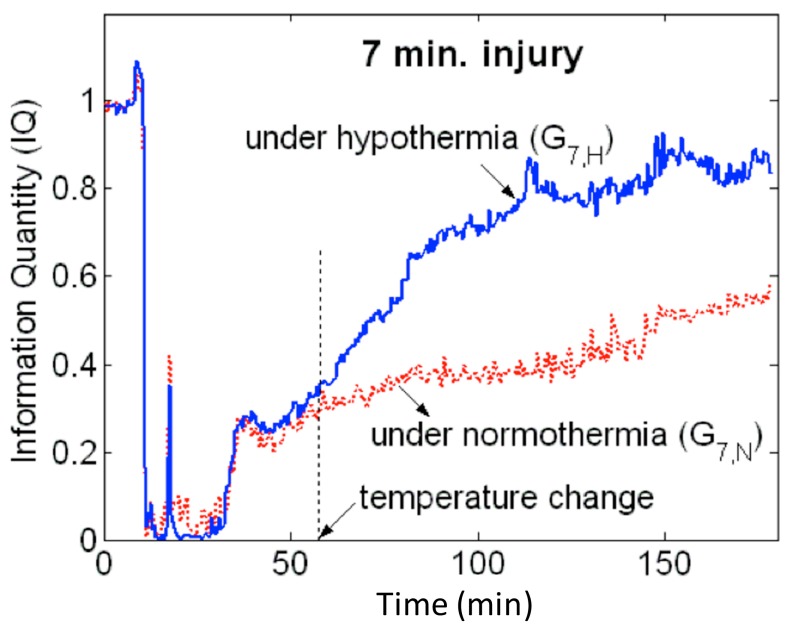
Figure 2.
Information Quantity (IQ) temporal evolution following a 7-min CA model in rats. The blue curve represents the IQ profile when TH was applied at the point marked as “temperature change.” The red curve represents the IQ profile when normothermia was maintained. At the onset of injury, there is a rapid drop of IQ values, but after the temperature change, the blue curve shows an increasing trend of higher IQ values compared to the red curve, displaying the protective effect of TH compared to normothermia.

