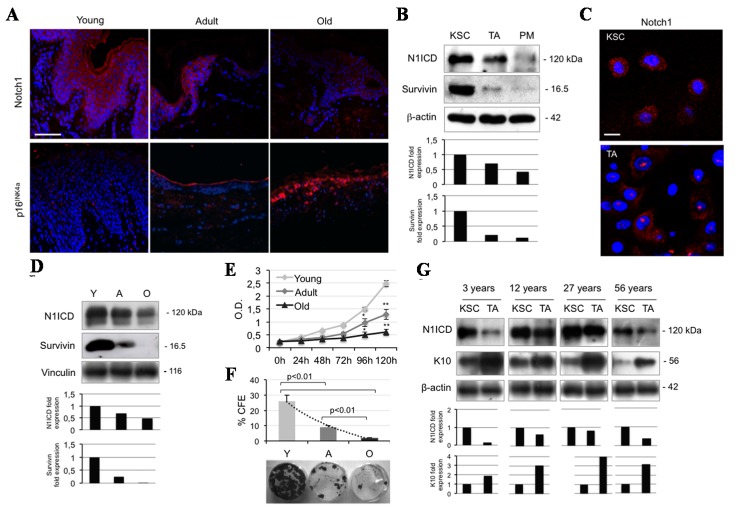
Figure 1.
Notch1 levels decrease both during ageing and cell differentiation in human keratinocytes. (A) Immunofluorescence staining for Notch1 and p16INK4a (red) in young, adult, and old skin biopsies. Cell nuclei were counterstained with DAPI (blue) (Bar = 200 µm); (B) Cells were analyzed immediately after separation, and levels of Notch1 activation (N1ICD) and survivin were determined by Western blot (WB) analysis. β-actin was used as loading control. Bar graphs show the average densitometry values normalized to β-actin; (C) Immunofluorescence staining was performed in situ on KSC (keratinocyte stem cells) and TA (transit amplifying) cell culture for survivin expression (red) and cell nuclei were counterstained with DAPI (blue) (Bar = 20 µm); (D) Survivin levels were analyzed immediately after isolation in young (Y), adult (A), and old (O) keratinocytes, and determined by WB analysis. Vinculin was used as loading control. Bar graphs show the average densitometry values normalized to vinculin; (E) The ability to proliferate in vitro of young, adult, and old keratinocytes was evaluated by MTT assay (* 0.01 < p < 0.05; ** p < 0.01); (F) Clonal growth assessment of young, adult, and old keratinocyte by CFE assay. At the bottom, representative pictures of CFE obtained by growing cells at clonal density and stained with CV are shown; (G) KSC and TA cells were analyzed immediately after separation, and levels of N1ICD and K10 (keratin 10) were determined by WB analysis. β-actin was used as loading control. Bar graphs show the average densitometry values normalized to β-actin.

